Immigrants from Australia vs Slovak Vision Disability
COMPARE
Immigrants from Australia
Slovak
Vision Disability
Vision Disability Comparison
Immigrants from Australia
Slovaks
1.9%
VISION DISABILITY
99.8/ 100
METRIC RATING
35th/ 347
METRIC RANK
2.2%
VISION DISABILITY
18.8/ 100
METRIC RATING
201st/ 347
METRIC RANK
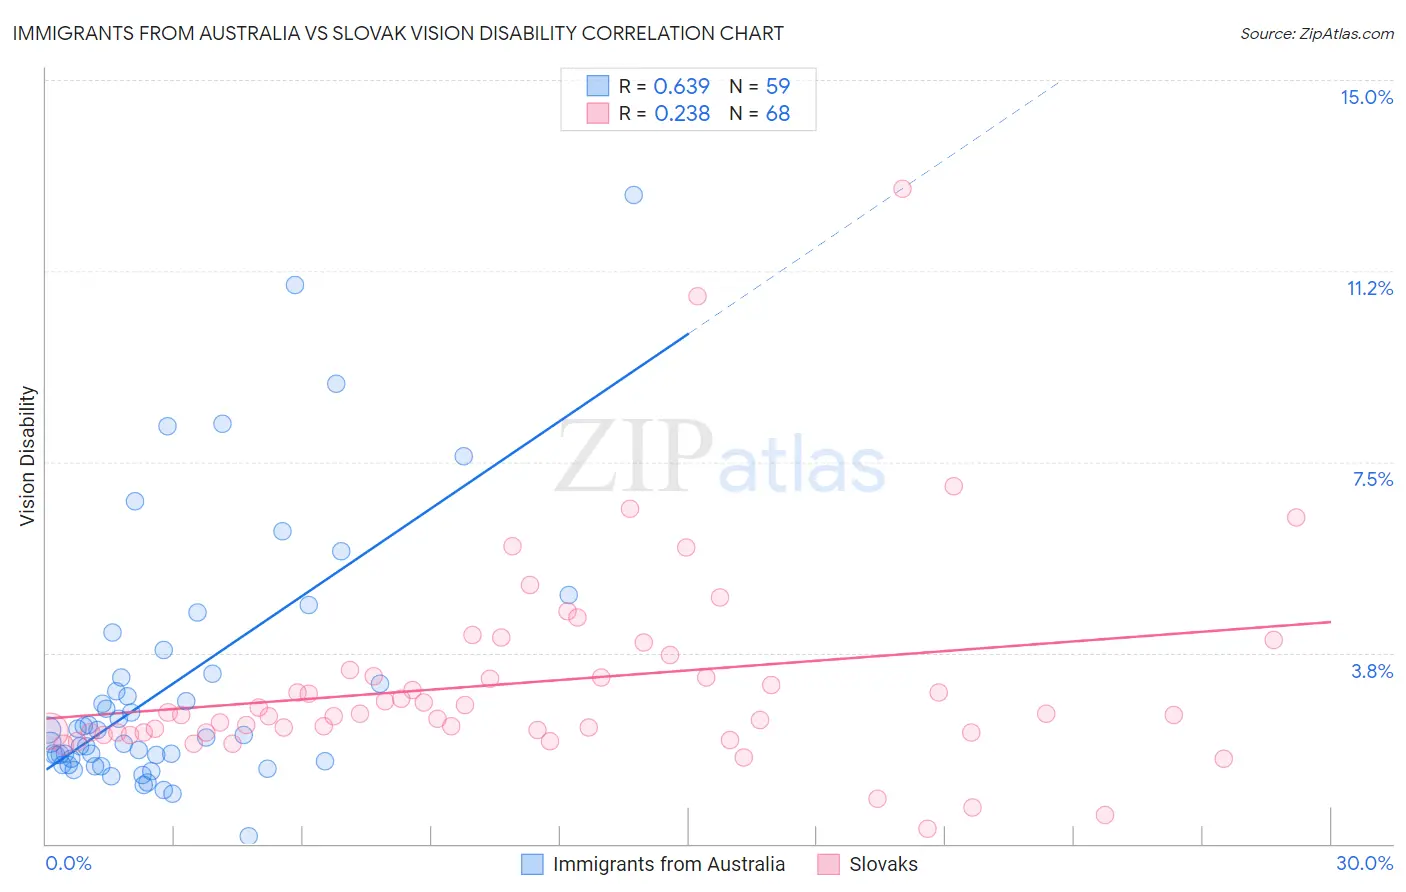
Immigrants from Australia vs Slovak Vision Disability Correlation Chart
The statistical analysis conducted on geographies consisting of 227,117,952 people shows a significant positive correlation between the proportion of Immigrants from Australia and percentage of population with vision disability in the United States with a correlation coefficient (R) of 0.639 and weighted average of 1.9%. Similarly, the statistical analysis conducted on geographies consisting of 397,414,578 people shows a weak positive correlation between the proportion of Slovaks and percentage of population with vision disability in the United States with a correlation coefficient (R) of 0.238 and weighted average of 2.2%, a difference of 13.7%.
Vision Disability Correlation Summary
| Measurement | Immigrants from Australia | Slovak |
| Minimum | 0.16% | 0.29% |
| Maximum | 12.7% | 12.9% |
| Range | 12.6% | 12.6% |
| Mean | 3.1% | 3.2% |
| Median | 2.1% | 2.5% |
| Interquartile 25% (IQ1) | 1.6% | 2.2% |
| Interquartile 75% (IQ3) | 3.3% | 3.3% |
| Interquartile Range (IQR) | 1.7% | 1.2% |
| Standard Deviation (Sample) | 2.6% | 2.0% |
| Standard Deviation (Population) | 2.5% | 2.0% |
Similar Demographics by Vision Disability
Demographics Similar to Immigrants from Australia by Vision Disability
In terms of vision disability, the demographic groups most similar to Immigrants from Australia are Immigrants from Turkey (1.9%, a difference of 0.10%), Immigrants from Egypt (1.9%, a difference of 0.22%), Cambodian (2.0%, a difference of 0.35%), Luxembourger (1.9%, a difference of 0.53%), and Bhutanese (2.0%, a difference of 0.60%).
| Demographics | Rating | Rank | Vision Disability |
| Immigrants | Malaysia | 99.9 /100 | #28 | Exceptional 1.9% |
| Egyptians | 99.9 /100 | #29 | Exceptional 1.9% |
| Immigrants | Nepal | 99.9 /100 | #30 | Exceptional 1.9% |
| Mongolians | 99.9 /100 | #31 | Exceptional 1.9% |
| Luxembourgers | 99.9 /100 | #32 | Exceptional 1.9% |
| Immigrants | Egypt | 99.9 /100 | #33 | Exceptional 1.9% |
| Immigrants | Turkey | 99.8 /100 | #34 | Exceptional 1.9% |
| Immigrants | Australia | 99.8 /100 | #35 | Exceptional 1.9% |
| Cambodians | 99.8 /100 | #36 | Exceptional 2.0% |
| Bhutanese | 99.8 /100 | #37 | Exceptional 2.0% |
| Immigrants | Kuwait | 99.8 /100 | #38 | Exceptional 2.0% |
| Zimbabweans | 99.7 /100 | #39 | Exceptional 2.0% |
| Immigrants | Ireland | 99.7 /100 | #40 | Exceptional 2.0% |
| Cypriots | 99.7 /100 | #41 | Exceptional 2.0% |
| Immigrants | Ethiopia | 99.7 /100 | #42 | Exceptional 2.0% |
Demographics Similar to Slovaks by Vision Disability
In terms of vision disability, the demographic groups most similar to Slovaks are Immigrants from Zaire (2.2%, a difference of 0.090%), Immigrants from Thailand (2.2%, a difference of 0.13%), Dutch (2.2%, a difference of 0.18%), Immigrants from El Salvador (2.2%, a difference of 0.21%), and Czechoslovakian (2.2%, a difference of 0.27%).
| Demographics | Rating | Rank | Vision Disability |
| Immigrants | Barbados | 24.0 /100 | #194 | Fair 2.2% |
| Immigrants | Immigrants | 23.7 /100 | #195 | Fair 2.2% |
| Immigrants | Grenada | 23.1 /100 | #196 | Fair 2.2% |
| Ghanaians | 21.8 /100 | #197 | Fair 2.2% |
| Czechoslovakians | 21.6 /100 | #198 | Fair 2.2% |
| Immigrants | El Salvador | 21.0 /100 | #199 | Fair 2.2% |
| Immigrants | Thailand | 20.1 /100 | #200 | Fair 2.2% |
| Slovaks | 18.8 /100 | #201 | Poor 2.2% |
| Immigrants | Zaire | 18.0 /100 | #202 | Poor 2.2% |
| Dutch | 17.1 /100 | #203 | Poor 2.2% |
| Immigrants | Guyana | 15.9 /100 | #204 | Poor 2.2% |
| Samoans | 15.7 /100 | #205 | Poor 2.2% |
| Pennsylvania Germans | 14.5 /100 | #206 | Poor 2.2% |
| Immigrants | Nigeria | 13.5 /100 | #207 | Poor 2.2% |
| Germans | 13.4 /100 | #208 | Poor 2.2% |