Immigrants from Cameroon vs Immigrants from Egypt Ambulatory Disability
COMPARE
Immigrants from Cameroon
Immigrants from Egypt
Ambulatory Disability
Ambulatory Disability Comparison
Immigrants from Cameroon
Immigrants from Egypt
5.7%
AMBULATORY DISABILITY
99.4/ 100
METRIC RATING
74th/ 347
METRIC RANK
5.6%
AMBULATORY DISABILITY
99.8/ 100
METRIC RATING
53rd/ 347
METRIC RANK
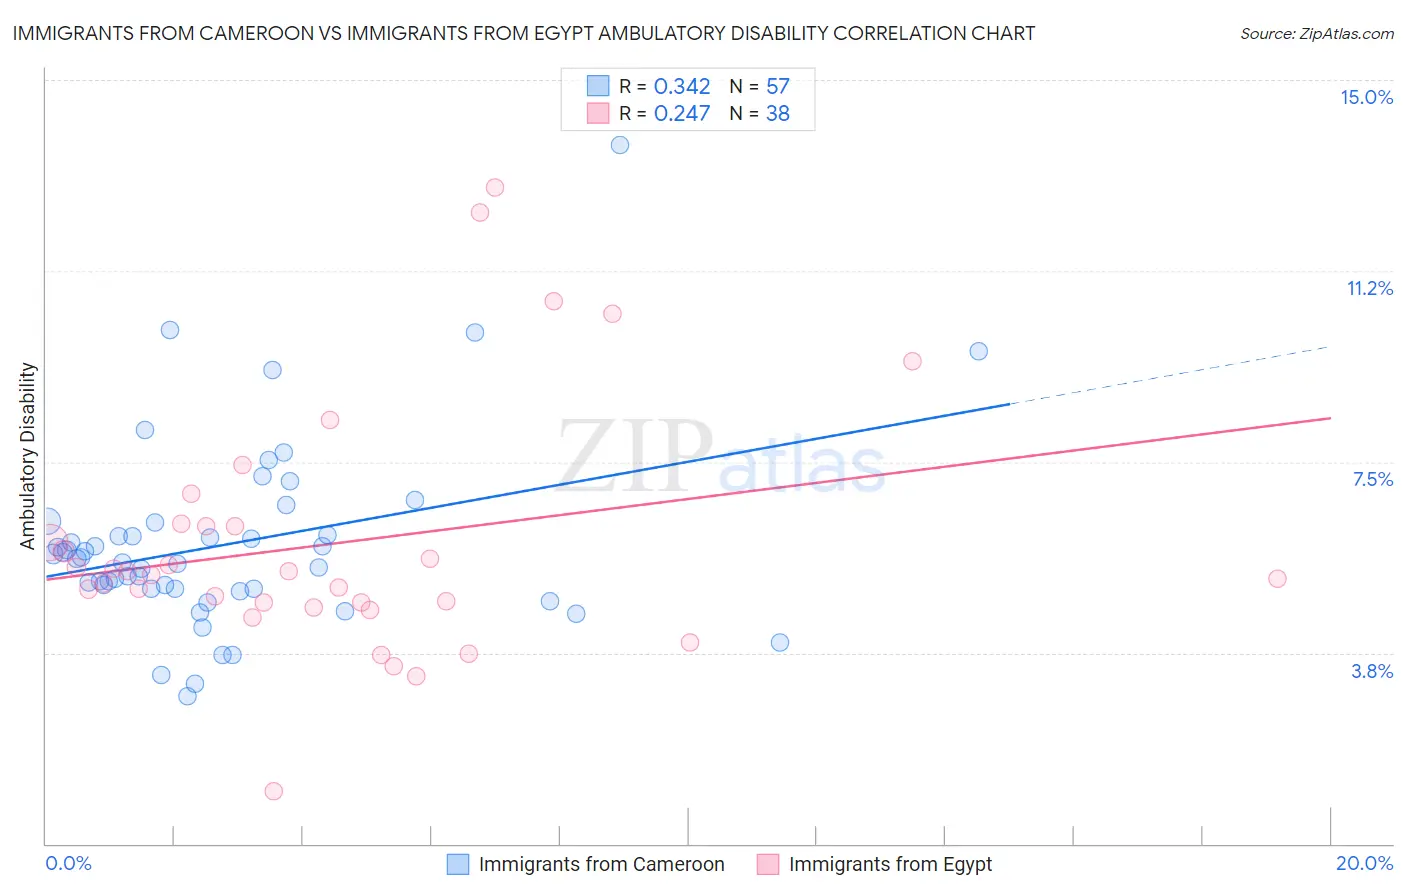
Immigrants from Cameroon vs Immigrants from Egypt Ambulatory Disability Correlation Chart
The statistical analysis conducted on geographies consisting of 130,739,199 people shows a mild positive correlation between the proportion of Immigrants from Cameroon and percentage of population with ambulatory disability in the United States with a correlation coefficient (R) of 0.342 and weighted average of 5.7%. Similarly, the statistical analysis conducted on geographies consisting of 245,460,331 people shows a weak positive correlation between the proportion of Immigrants from Egypt and percentage of population with ambulatory disability in the United States with a correlation coefficient (R) of 0.247 and weighted average of 5.6%, a difference of 1.9%.
Ambulatory Disability Correlation Summary
| Measurement | Immigrants from Cameroon | Immigrants from Egypt |
| Minimum | 2.9% | 1.0% |
| Maximum | 13.7% | 12.9% |
| Range | 10.8% | 11.9% |
| Mean | 5.9% | 5.9% |
| Median | 5.6% | 5.3% |
| Interquartile 25% (IQ1) | 5.0% | 4.7% |
| Interquartile 75% (IQ3) | 6.2% | 6.2% |
| Interquartile Range (IQR) | 1.2% | 1.5% |
| Standard Deviation (Sample) | 1.9% | 2.4% |
| Standard Deviation (Population) | 1.8% | 2.4% |
Similar Demographics by Ambulatory Disability
Demographics Similar to Immigrants from Cameroon by Ambulatory Disability
In terms of ambulatory disability, the demographic groups most similar to Immigrants from Cameroon are Immigrants from Northern Africa (5.7%, a difference of 0.010%), Brazilian (5.7%, a difference of 0.020%), Immigrants from Peru (5.7%, a difference of 0.040%), Immigrants from South Africa (5.7%, a difference of 0.050%), and Sudanese (5.7%, a difference of 0.070%).
| Demographics | Rating | Rank | Ambulatory Disability |
| Immigrants | Uganda | 99.6 /100 | #67 | Exceptional 5.7% |
| Sri Lankans | 99.6 /100 | #68 | Exceptional 5.7% |
| Peruvians | 99.5 /100 | #69 | Exceptional 5.7% |
| Sierra Leoneans | 99.4 /100 | #70 | Exceptional 5.7% |
| Immigrants | Peru | 99.4 /100 | #71 | Exceptional 5.7% |
| Brazilians | 99.4 /100 | #72 | Exceptional 5.7% |
| Immigrants | Northern Africa | 99.4 /100 | #73 | Exceptional 5.7% |
| Immigrants | Cameroon | 99.4 /100 | #74 | Exceptional 5.7% |
| Immigrants | South Africa | 99.3 /100 | #75 | Exceptional 5.7% |
| Sudanese | 99.3 /100 | #76 | Exceptional 5.7% |
| Immigrants | Vietnam | 99.3 /100 | #77 | Exceptional 5.7% |
| Somalis | 99.2 /100 | #78 | Exceptional 5.7% |
| Chileans | 99.2 /100 | #79 | Exceptional 5.7% |
| Immigrants | Ireland | 99.2 /100 | #80 | Exceptional 5.7% |
| Immigrants | Jordan | 99.2 /100 | #81 | Exceptional 5.7% |
Demographics Similar to Immigrants from Egypt by Ambulatory Disability
In terms of ambulatory disability, the demographic groups most similar to Immigrants from Egypt are Jordanian (5.6%, a difference of 0.010%), Immigrants from Eastern Africa (5.6%, a difference of 0.050%), Taiwanese (5.6%, a difference of 0.10%), Immigrants from Bulgaria (5.6%, a difference of 0.11%), and Luxembourger (5.6%, a difference of 0.20%).
| Demographics | Rating | Rank | Ambulatory Disability |
| Egyptians | 99.9 /100 | #46 | Exceptional 5.6% |
| Immigrants | Japan | 99.9 /100 | #47 | Exceptional 5.6% |
| Immigrants | Argentina | 99.9 /100 | #48 | Exceptional 5.6% |
| Bulgarians | 99.9 /100 | #49 | Exceptional 5.6% |
| Luxembourgers | 99.9 /100 | #50 | Exceptional 5.6% |
| Taiwanese | 99.8 /100 | #51 | Exceptional 5.6% |
| Jordanians | 99.8 /100 | #52 | Exceptional 5.6% |
| Immigrants | Egypt | 99.8 /100 | #53 | Exceptional 5.6% |
| Immigrants | Eastern Africa | 99.8 /100 | #54 | Exceptional 5.6% |
| Immigrants | Bulgaria | 99.8 /100 | #55 | Exceptional 5.6% |
| Inupiat | 99.8 /100 | #56 | Exceptional 5.6% |
| Immigrants | Brazil | 99.8 /100 | #57 | Exceptional 5.6% |
| Immigrants | Zimbabwe | 99.8 /100 | #58 | Exceptional 5.6% |
| Immigrants | Afghanistan | 99.8 /100 | #59 | Exceptional 5.6% |
| Immigrants | Lithuania | 99.8 /100 | #60 | Exceptional 5.6% |