Immigrants from Armenia vs Immigrants from Pakistan Disability Age 18 to 34
COMPARE
Immigrants from Armenia
Immigrants from Pakistan
Disability Age 18 to 34
Disability Age 18 to 34 Comparison
Immigrants from Armenia
Immigrants from Pakistan
5.0%
DISABILITY AGE 18 TO 34
100.0/ 100
METRIC RATING
1st/ 347
METRIC RANK
5.8%
DISABILITY AGE 18 TO 34
99.9/ 100
METRIC RATING
30th/ 347
METRIC RANK
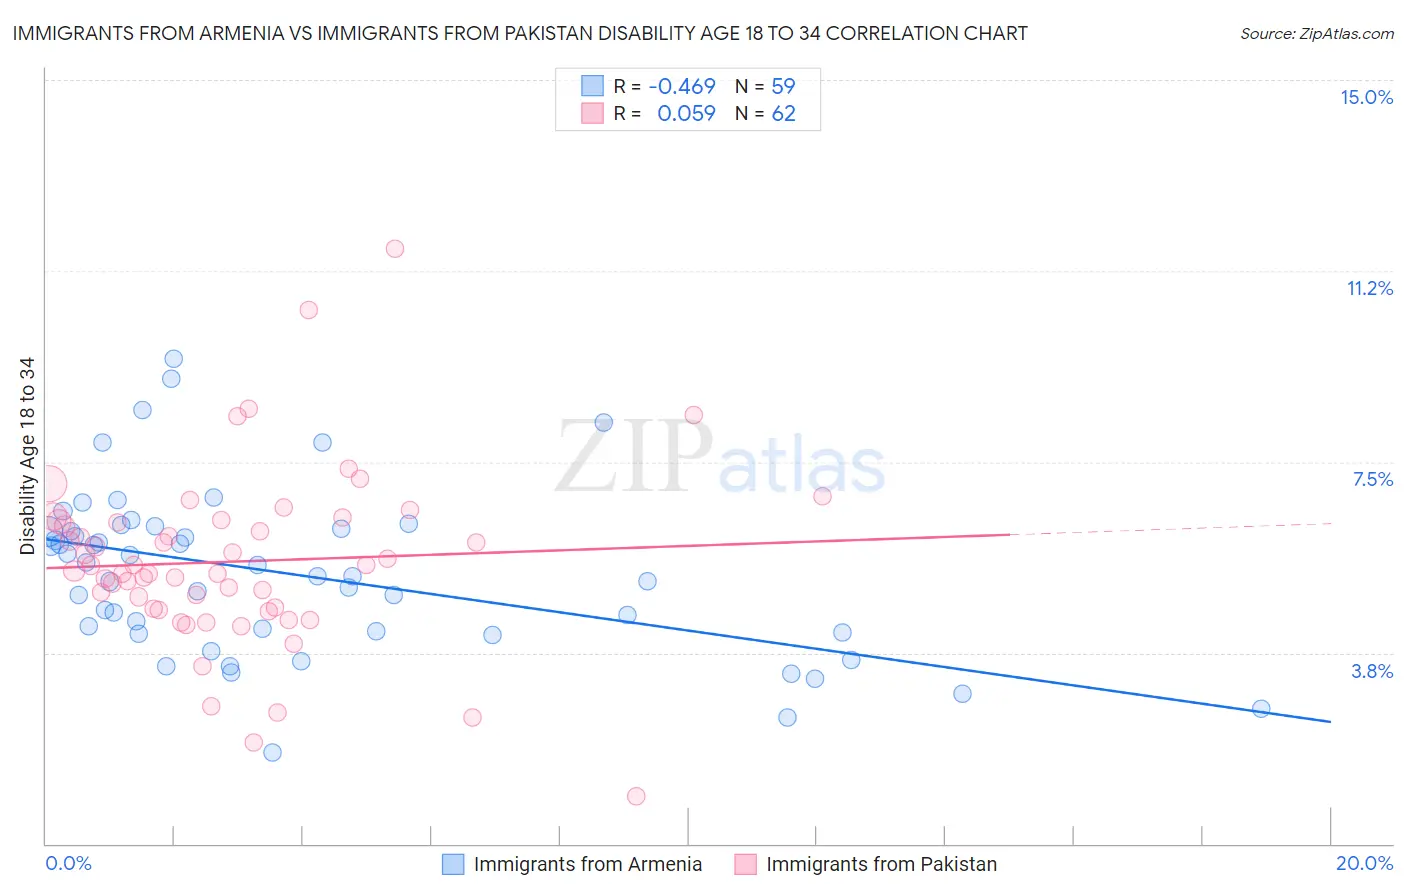
Immigrants from Armenia vs Immigrants from Pakistan Disability Age 18 to 34 Correlation Chart
The statistical analysis conducted on geographies consisting of 97,601,753 people shows a moderate negative correlation between the proportion of Immigrants from Armenia and percentage of population with a disability between the ages 18 and 35 in the United States with a correlation coefficient (R) of -0.469 and weighted average of 5.0%. Similarly, the statistical analysis conducted on geographies consisting of 283,620,664 people shows a slight positive correlation between the proportion of Immigrants from Pakistan and percentage of population with a disability between the ages 18 and 35 in the United States with a correlation coefficient (R) of 0.059 and weighted average of 5.8%, a difference of 15.0%.
Disability Age 18 to 34 Correlation Summary
| Measurement | Immigrants from Armenia | Immigrants from Pakistan |
| Minimum | 1.8% | 0.93% |
| Maximum | 9.5% | 11.7% |
| Range | 7.7% | 10.7% |
| Mean | 5.3% | 5.5% |
| Median | 5.3% | 5.4% |
| Interquartile 25% (IQ1) | 4.1% | 4.6% |
| Interquartile 75% (IQ3) | 6.2% | 6.3% |
| Interquartile Range (IQR) | 2.0% | 1.7% |
| Standard Deviation (Sample) | 1.6% | 1.8% |
| Standard Deviation (Population) | 1.6% | 1.7% |
Similar Demographics by Disability Age 18 to 34
Demographics Similar to Immigrants from Armenia by Disability Age 18 to 34
In terms of disability age 18 to 34, the demographic groups most similar to Immigrants from Armenia are Immigrants from Hong Kong (5.2%, a difference of 4.3%), Immigrants from Grenada (5.3%, a difference of 6.5%), Immigrants from Cuba (5.4%, a difference of 7.2%), Immigrants from Taiwan (5.4%, a difference of 7.5%), and Filipino (5.4%, a difference of 8.9%).
| Demographics | Rating | Rank | Disability Age 18 to 34 |
| Immigrants | Armenia | 100.0 /100 | #1 | Exceptional 5.0% |
| Immigrants | Hong Kong | 100.0 /100 | #2 | Exceptional 5.2% |
| Immigrants | Grenada | 100.0 /100 | #3 | Exceptional 5.3% |
| Immigrants | Cuba | 100.0 /100 | #4 | Exceptional 5.4% |
| Immigrants | Taiwan | 100.0 /100 | #5 | Exceptional 5.4% |
| Filipinos | 100.0 /100 | #6 | Exceptional 5.4% |
| Immigrants | China | 100.0 /100 | #7 | Exceptional 5.4% |
| Immigrants | Guyana | 100.0 /100 | #8 | Exceptional 5.5% |
| Guyanese | 100.0 /100 | #9 | Exceptional 5.5% |
| Immigrants | Uzbekistan | 100.0 /100 | #10 | Exceptional 5.5% |
| Vietnamese | 100.0 /100 | #11 | Exceptional 5.5% |
| Immigrants | St. Vincent and the Grenadines | 100.0 /100 | #12 | Exceptional 5.5% |
| Immigrants | Iran | 100.0 /100 | #13 | Exceptional 5.5% |
| Indians (Asian) | 100.0 /100 | #14 | Exceptional 5.5% |
| Immigrants | India | 100.0 /100 | #15 | Exceptional 5.6% |
Demographics Similar to Immigrants from Pakistan by Disability Age 18 to 34
In terms of disability age 18 to 34, the demographic groups most similar to Immigrants from Pakistan are Immigrants from Ecuador (5.7%, a difference of 0.20%), Soviet Union (5.7%, a difference of 0.29%), Iranian (5.8%, a difference of 0.32%), Immigrants from Barbados (5.8%, a difference of 0.32%), and Argentinean (5.8%, a difference of 0.35%).
| Demographics | Rating | Rank | Disability Age 18 to 34 |
| Cubans | 100.0 /100 | #23 | Exceptional 5.7% |
| Immigrants | Argentina | 100.0 /100 | #24 | Exceptional 5.7% |
| Immigrants | Singapore | 100.0 /100 | #25 | Exceptional 5.7% |
| Immigrants | Colombia | 100.0 /100 | #26 | Exceptional 5.7% |
| Immigrants | Venezuela | 99.9 /100 | #27 | Exceptional 5.7% |
| Soviet Union | 99.9 /100 | #28 | Exceptional 5.7% |
| Immigrants | Ecuador | 99.9 /100 | #29 | Exceptional 5.7% |
| Immigrants | Pakistan | 99.9 /100 | #30 | Exceptional 5.8% |
| Iranians | 99.9 /100 | #31 | Exceptional 5.8% |
| Immigrants | Barbados | 99.9 /100 | #32 | Exceptional 5.8% |
| Argentineans | 99.9 /100 | #33 | Exceptional 5.8% |
| Venezuelans | 99.9 /100 | #34 | Exceptional 5.8% |
| Immigrants | Lithuania | 99.9 /100 | #35 | Exceptional 5.8% |
| Ecuadorians | 99.9 /100 | #36 | Exceptional 5.8% |
| Armenians | 99.9 /100 | #37 | Exceptional 5.8% |