Immigrants from Armenia vs Immigrants from Eastern Asia Ambulatory Disability
COMPARE
Immigrants from Armenia
Immigrants from Eastern Asia
Ambulatory Disability
Ambulatory Disability Comparison
Immigrants from Armenia
Immigrants from Eastern Asia
7.0%
AMBULATORY DISABILITY
0.0/ 100
METRIC RATING
302nd/ 347
METRIC RANK
5.3%
AMBULATORY DISABILITY
100.0/ 100
METRIC RATING
14th/ 347
METRIC RANK
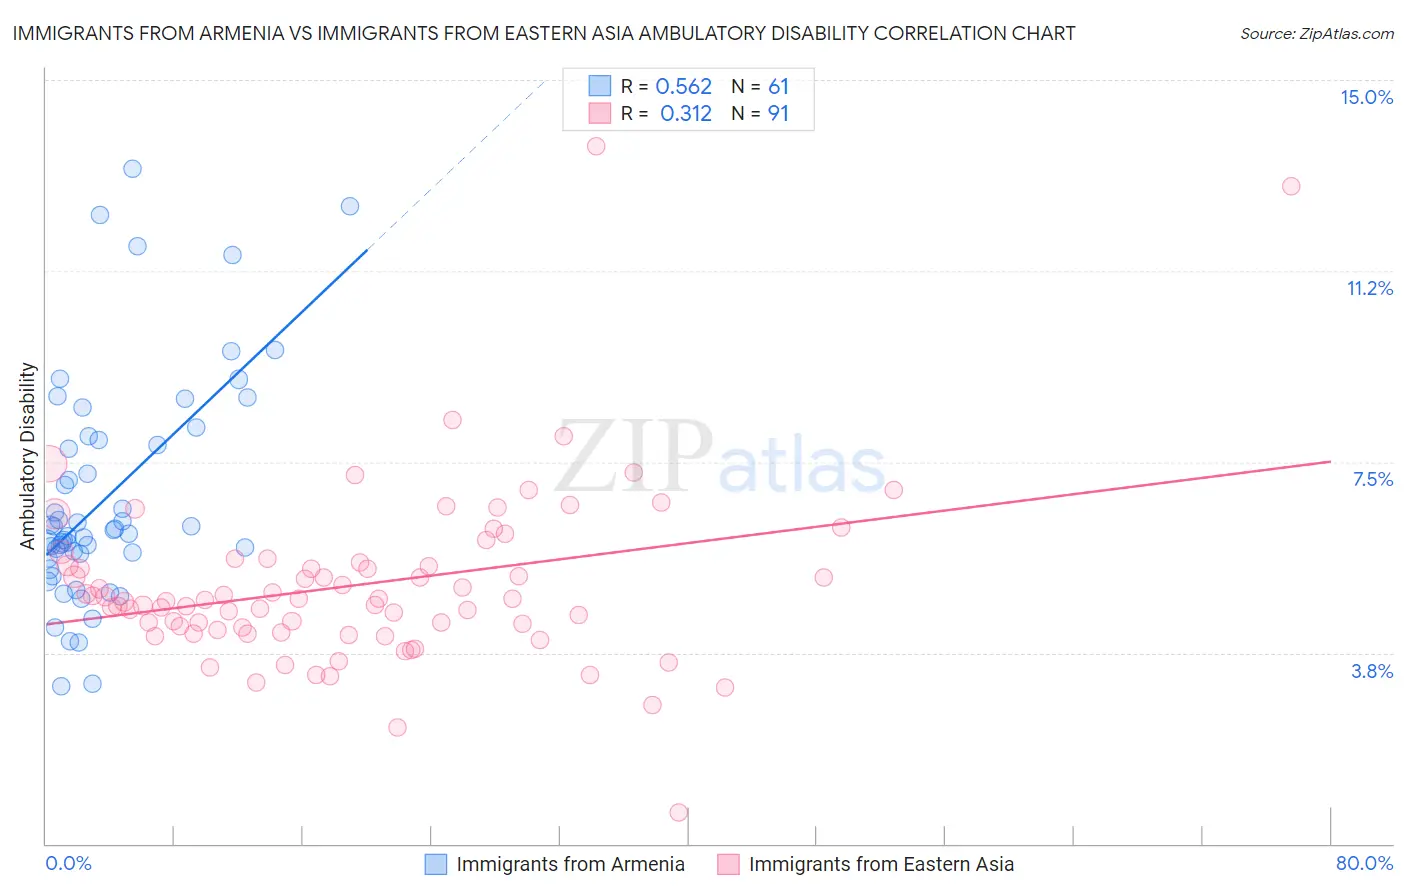
Immigrants from Armenia vs Immigrants from Eastern Asia Ambulatory Disability Correlation Chart
The statistical analysis conducted on geographies consisting of 97,709,765 people shows a substantial positive correlation between the proportion of Immigrants from Armenia and percentage of population with ambulatory disability in the United States with a correlation coefficient (R) of 0.562 and weighted average of 7.0%. Similarly, the statistical analysis conducted on geographies consisting of 499,616,873 people shows a mild positive correlation between the proportion of Immigrants from Eastern Asia and percentage of population with ambulatory disability in the United States with a correlation coefficient (R) of 0.312 and weighted average of 5.3%, a difference of 31.6%.
Ambulatory Disability Correlation Summary
| Measurement | Immigrants from Armenia | Immigrants from Eastern Asia |
| Minimum | 3.1% | 0.61% |
| Maximum | 13.3% | 13.7% |
| Range | 10.2% | 13.1% |
| Mean | 6.8% | 5.1% |
| Median | 6.2% | 4.8% |
| Interquartile 25% (IQ1) | 5.6% | 4.2% |
| Interquartile 75% (IQ3) | 8.0% | 5.5% |
| Interquartile Range (IQR) | 2.3% | 1.3% |
| Standard Deviation (Sample) | 2.2% | 1.8% |
| Standard Deviation (Population) | 2.2% | 1.7% |
Similar Demographics by Ambulatory Disability
Demographics Similar to Immigrants from Armenia by Ambulatory Disability
In terms of ambulatory disability, the demographic groups most similar to Immigrants from Armenia are British West Indian (7.0%, a difference of 0.060%), African (7.0%, a difference of 0.060%), Marshallese (6.9%, a difference of 0.28%), Puget Sound Salish (6.9%, a difference of 0.30%), and Immigrants from Cabo Verde (7.0%, a difference of 0.42%).
| Demographics | Rating | Rank | Ambulatory Disability |
| Crow | 0.0 /100 | #295 | Tragic 6.9% |
| Alaskan Athabascans | 0.0 /100 | #296 | Tragic 6.9% |
| French American Indians | 0.0 /100 | #297 | Tragic 6.9% |
| Immigrants | Grenada | 0.0 /100 | #298 | Tragic 6.9% |
| Puget Sound Salish | 0.0 /100 | #299 | Tragic 6.9% |
| Marshallese | 0.0 /100 | #300 | Tragic 6.9% |
| British West Indians | 0.0 /100 | #301 | Tragic 7.0% |
| Immigrants | Armenia | 0.0 /100 | #302 | Tragic 7.0% |
| Africans | 0.0 /100 | #303 | Tragic 7.0% |
| Immigrants | Cabo Verde | 0.0 /100 | #304 | Tragic 7.0% |
| Immigrants | Micronesia | 0.0 /100 | #305 | Tragic 7.0% |
| Iroquois | 0.0 /100 | #306 | Tragic 7.1% |
| Spanish Americans | 0.0 /100 | #307 | Tragic 7.1% |
| Chippewa | 0.0 /100 | #308 | Tragic 7.1% |
| Immigrants | Azores | 0.0 /100 | #309 | Tragic 7.1% |
Demographics Similar to Immigrants from Eastern Asia by Ambulatory Disability
In terms of ambulatory disability, the demographic groups most similar to Immigrants from Eastern Asia are Burmese (5.3%, a difference of 0.15%), Immigrants from China (5.3%, a difference of 0.33%), Okinawan (5.3%, a difference of 0.65%), Immigrants from Hong Kong (5.3%, a difference of 0.87%), and Immigrants from Korea (5.2%, a difference of 0.96%).
| Demographics | Rating | Rank | Ambulatory Disability |
| Bolivians | 100.0 /100 | #7 | Exceptional 5.1% |
| Immigrants | South Central Asia | 100.0 /100 | #8 | Exceptional 5.1% |
| Iranians | 100.0 /100 | #9 | Exceptional 5.1% |
| Yup'ik | 100.0 /100 | #10 | Exceptional 5.2% |
| Immigrants | Korea | 100.0 /100 | #11 | Exceptional 5.2% |
| Okinawans | 100.0 /100 | #12 | Exceptional 5.3% |
| Burmese | 100.0 /100 | #13 | Exceptional 5.3% |
| Immigrants | Eastern Asia | 100.0 /100 | #14 | Exceptional 5.3% |
| Immigrants | China | 100.0 /100 | #15 | Exceptional 5.3% |
| Immigrants | Hong Kong | 100.0 /100 | #16 | Exceptional 5.3% |
| Immigrants | Ethiopia | 100.0 /100 | #17 | Exceptional 5.4% |
| Immigrants | Sri Lanka | 100.0 /100 | #18 | Exceptional 5.4% |
| Indians (Asian) | 100.0 /100 | #19 | Exceptional 5.4% |
| Ethiopians | 100.0 /100 | #20 | Exceptional 5.4% |
| Immigrants | Kuwait | 100.0 /100 | #21 | Exceptional 5.4% |