Spanish American Indian vs Spanish Disability Age 35 to 64
COMPARE
Spanish American Indian
Spanish
Disability Age 35 to 64
Disability Age 35 to 64 Comparison
Spanish American Indians
Spanish
11.7%
DISABILITY AGE 35 TO 64
11.1/ 100
METRIC RATING
215th/ 347
METRIC RANK
12.7%
DISABILITY AGE 35 TO 64
0.2/ 100
METRIC RATING
269th/ 347
METRIC RANK
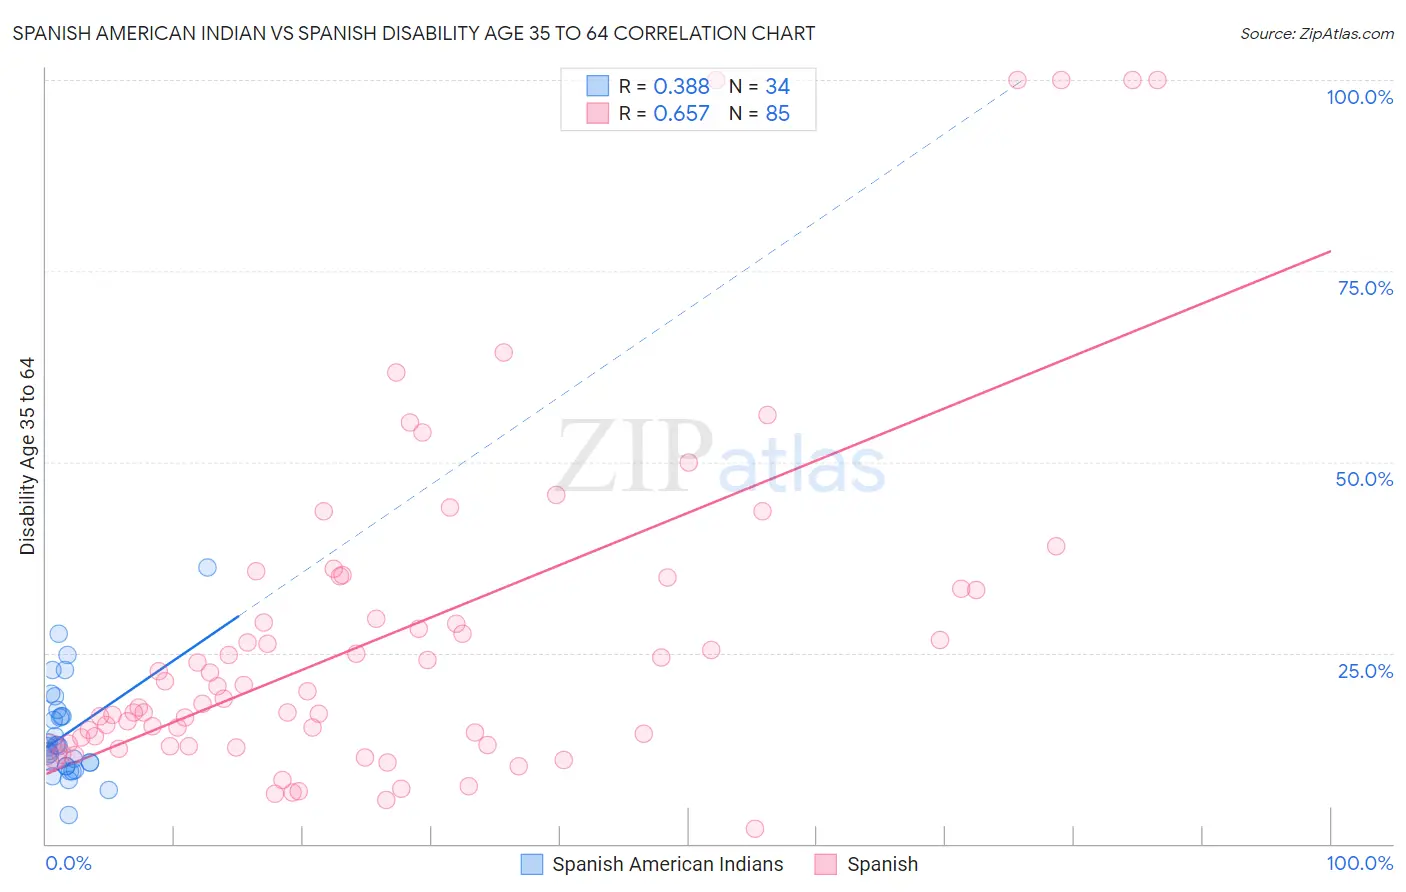
Spanish American Indian vs Spanish Disability Age 35 to 64 Correlation Chart
The statistical analysis conducted on geographies consisting of 73,144,016 people shows a mild positive correlation between the proportion of Spanish American Indians and percentage of population with a disability between the ages 34 and 64 in the United States with a correlation coefficient (R) of 0.388 and weighted average of 11.7%. Similarly, the statistical analysis conducted on geographies consisting of 421,846,574 people shows a significant positive correlation between the proportion of Spanish and percentage of population with a disability between the ages 34 and 64 in the United States with a correlation coefficient (R) of 0.657 and weighted average of 12.7%, a difference of 8.0%.
Disability Age 35 to 64 Correlation Summary
| Measurement | Spanish American Indian | Spanish |
| Minimum | 3.7% | 2.0% |
| Maximum | 36.1% | 100.0% |
| Range | 32.4% | 98.0% |
| Mean | 14.4% | 27.5% |
| Median | 12.7% | 19.9% |
| Interquartile 25% (IQ1) | 10.2% | 13.1% |
| Interquartile 75% (IQ3) | 16.7% | 34.1% |
| Interquartile Range (IQR) | 6.5% | 21.1% |
| Standard Deviation (Sample) | 6.5% | 22.7% |
| Standard Deviation (Population) | 6.4% | 22.5% |
Similar Demographics by Disability Age 35 to 64
Demographics Similar to Spanish American Indians by Disability Age 35 to 64
In terms of disability age 35 to 64, the demographic groups most similar to Spanish American Indians are Immigrants from Sudan (11.7%, a difference of 0.050%), Yugoslavian (11.7%, a difference of 0.090%), Bahamian (11.8%, a difference of 0.090%), Immigrants from Jamaica (11.7%, a difference of 0.12%), and Canadian (11.7%, a difference of 0.34%).
| Demographics | Rating | Rank | Disability Age 35 to 64 |
| Guatemalans | 14.6 /100 | #208 | Poor 11.7% |
| Europeans | 13.5 /100 | #209 | Poor 11.7% |
| Belgians | 13.1 /100 | #210 | Poor 11.7% |
| Canadians | 13.0 /100 | #211 | Poor 11.7% |
| Immigrants | Jamaica | 11.8 /100 | #212 | Poor 11.7% |
| Yugoslavians | 11.6 /100 | #213 | Poor 11.7% |
| Immigrants | Sudan | 11.4 /100 | #214 | Poor 11.7% |
| Spanish American Indians | 11.1 /100 | #215 | Poor 11.7% |
| Bahamians | 10.7 /100 | #216 | Poor 11.8% |
| Barbadians | 9.5 /100 | #217 | Tragic 11.8% |
| Immigrants | Bahamas | 9.2 /100 | #218 | Tragic 11.8% |
| Czechoslovakians | 9.0 /100 | #219 | Tragic 11.8% |
| Immigrants | West Indies | 8.9 /100 | #220 | Tragic 11.8% |
| Alsatians | 8.5 /100 | #221 | Tragic 11.8% |
| Hondurans | 8.4 /100 | #222 | Tragic 11.8% |
Demographics Similar to Spanish by Disability Age 35 to 64
In terms of disability age 35 to 64, the demographic groups most similar to Spanish are French (12.7%, a difference of 0.040%), Immigrants from Dominica (12.7%, a difference of 0.10%), Subsaharan African (12.6%, a difference of 0.28%), White/Caucasian (12.6%, a difference of 0.44%), and Nepalese (12.8%, a difference of 1.1%).
| Demographics | Rating | Rank | Disability Age 35 to 64 |
| Senegalese | 0.5 /100 | #262 | Tragic 12.5% |
| Immigrants | Zaire | 0.4 /100 | #263 | Tragic 12.5% |
| Immigrants | Portugal | 0.4 /100 | #264 | Tragic 12.5% |
| Marshallese | 0.4 /100 | #265 | Tragic 12.5% |
| Whites/Caucasians | 0.3 /100 | #266 | Tragic 12.6% |
| Sub-Saharan Africans | 0.2 /100 | #267 | Tragic 12.6% |
| Immigrants | Dominica | 0.2 /100 | #268 | Tragic 12.7% |
| Spanish | 0.2 /100 | #269 | Tragic 12.7% |
| French | 0.2 /100 | #270 | Tragic 12.7% |
| Nepalese | 0.1 /100 | #271 | Tragic 12.8% |
| U.S. Virgin Islanders | 0.1 /100 | #272 | Tragic 12.8% |
| Pennsylvania Germans | 0.1 /100 | #273 | Tragic 12.8% |
| Celtics | 0.1 /100 | #274 | Tragic 12.9% |
| Dominicans | 0.1 /100 | #275 | Tragic 12.9% |
| Somalis | 0.1 /100 | #276 | Tragic 12.9% |