Immigrants from Albania vs Mexican American Indian Hearing Disability
COMPARE
Immigrants from Albania
Mexican American Indian
Hearing Disability
Hearing Disability Comparison
Immigrants from Albania
Mexican American Indians
2.9%
HEARING DISABILITY
88.5/ 100
METRIC RATING
125th/ 347
METRIC RANK
3.0%
HEARING DISABILITY
34.7/ 100
METRIC RATING
188th/ 347
METRIC RANK
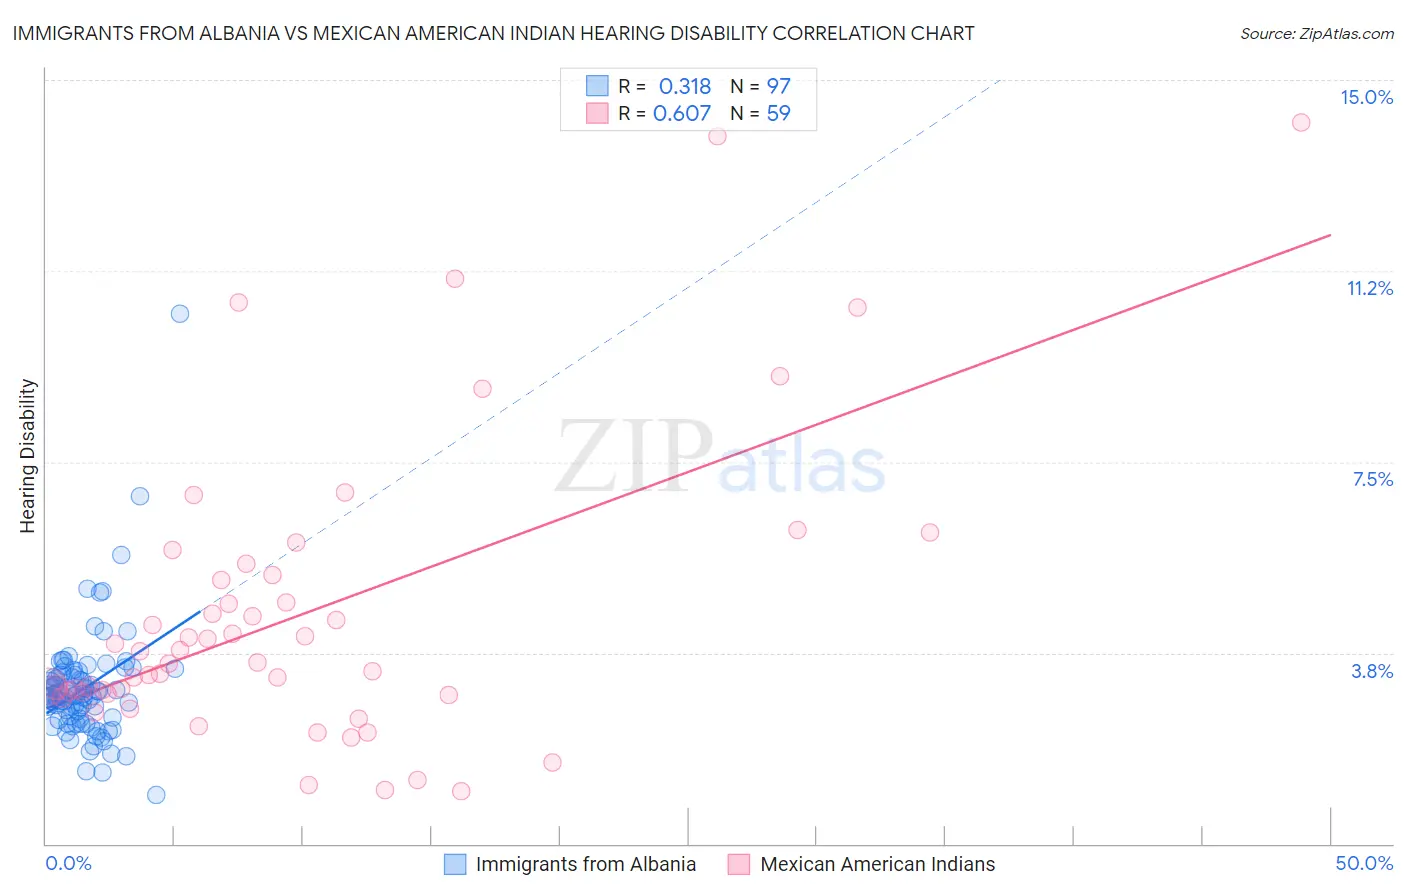
Immigrants from Albania vs Mexican American Indian Hearing Disability Correlation Chart
The statistical analysis conducted on geographies consisting of 119,393,957 people shows a mild positive correlation between the proportion of Immigrants from Albania and percentage of population with hearing disability in the United States with a correlation coefficient (R) of 0.318 and weighted average of 2.9%. Similarly, the statistical analysis conducted on geographies consisting of 317,548,375 people shows a significant positive correlation between the proportion of Mexican American Indians and percentage of population with hearing disability in the United States with a correlation coefficient (R) of 0.607 and weighted average of 3.0%, a difference of 6.6%.
Hearing Disability Correlation Summary
| Measurement | Immigrants from Albania | Mexican American Indian |
| Minimum | 0.95% | 1.0% |
| Maximum | 10.4% | 14.2% |
| Range | 9.5% | 13.2% |
| Mean | 3.0% | 4.5% |
| Median | 2.9% | 3.6% |
| Interquartile 25% (IQ1) | 2.5% | 2.9% |
| Interquartile 75% (IQ3) | 3.3% | 5.3% |
| Interquartile Range (IQR) | 0.85% | 2.3% |
| Standard Deviation (Sample) | 1.1% | 2.9% |
| Standard Deviation (Population) | 1.1% | 2.9% |
Similar Demographics by Hearing Disability
Demographics Similar to Immigrants from Albania by Hearing Disability
In terms of hearing disability, the demographic groups most similar to Immigrants from Albania are Immigrants from Zaire (2.9%, a difference of 0.030%), Bahamian (2.9%, a difference of 0.030%), Liberian (2.8%, a difference of 0.13%), Immigrants from Sudan (2.9%, a difference of 0.16%), and Cuban (2.8%, a difference of 0.22%).
| Demographics | Rating | Rank | Hearing Disability |
| Zimbabweans | 89.9 /100 | #118 | Excellent 2.8% |
| Kenyans | 89.8 /100 | #119 | Excellent 2.8% |
| Jordanians | 89.5 /100 | #120 | Excellent 2.8% |
| Cubans | 89.4 /100 | #121 | Excellent 2.8% |
| Liberians | 89.0 /100 | #122 | Excellent 2.8% |
| Immigrants | Zaire | 88.6 /100 | #123 | Excellent 2.9% |
| Bahamians | 88.6 /100 | #124 | Excellent 2.9% |
| Immigrants | Albania | 88.5 /100 | #125 | Excellent 2.9% |
| Immigrants | Sudan | 87.8 /100 | #126 | Excellent 2.9% |
| South American Indians | 86.9 /100 | #127 | Excellent 2.9% |
| Immigrants | Western Asia | 86.9 /100 | #128 | Excellent 2.9% |
| Immigrants | Uganda | 86.6 /100 | #129 | Excellent 2.9% |
| Immigrants | Vietnam | 86.5 /100 | #130 | Excellent 2.9% |
| Immigrants | Kenya | 86.1 /100 | #131 | Excellent 2.9% |
| Chileans | 85.8 /100 | #132 | Excellent 2.9% |
Demographics Similar to Mexican American Indians by Hearing Disability
In terms of hearing disability, the demographic groups most similar to Mexican American Indians are Black/African American (3.0%, a difference of 0.010%), Immigrants from Mexico (3.0%, a difference of 0.020%), Immigrants from Southern Europe (3.0%, a difference of 0.070%), African (3.0%, a difference of 0.19%), and Immigrants from Ireland (3.0%, a difference of 0.27%).
| Demographics | Rating | Rank | Hearing Disability |
| Immigrants | Belgium | 41.5 /100 | #181 | Average 3.0% |
| Immigrants | Italy | 41.1 /100 | #182 | Average 3.0% |
| Bulgarians | 39.7 /100 | #183 | Fair 3.0% |
| Immigrants | Ireland | 37.4 /100 | #184 | Fair 3.0% |
| Immigrants | Southern Europe | 35.3 /100 | #185 | Fair 3.0% |
| Immigrants | Mexico | 34.9 /100 | #186 | Fair 3.0% |
| Blacks/African Americans | 34.7 /100 | #187 | Fair 3.0% |
| Mexican American Indians | 34.7 /100 | #188 | Fair 3.0% |
| Africans | 32.9 /100 | #189 | Fair 3.0% |
| Immigrants | South Africa | 31.1 /100 | #190 | Fair 3.1% |
| Immigrants | Switzerland | 28.8 /100 | #191 | Fair 3.1% |
| Koreans | 27.6 /100 | #192 | Fair 3.1% |
| Macedonians | 27.0 /100 | #193 | Fair 3.1% |
| South Africans | 24.5 /100 | #194 | Fair 3.1% |
| Spanish American Indians | 24.1 /100 | #195 | Fair 3.1% |