Immigrants from Africa vs Colville 12th Grade, No Diploma
COMPARE
Immigrants from Africa
Colville
12th Grade, No Diploma
12th Grade, No Diploma Comparison
Immigrants from Africa
Colville
90.5%
12TH GRADE, NO DIPLOMA
8.5/ 100
METRIC RATING
214th/ 347
METRIC RANK
90.1%
12TH GRADE, NO DIPLOMA
2.3/ 100
METRIC RATING
235th/ 347
METRIC RANK
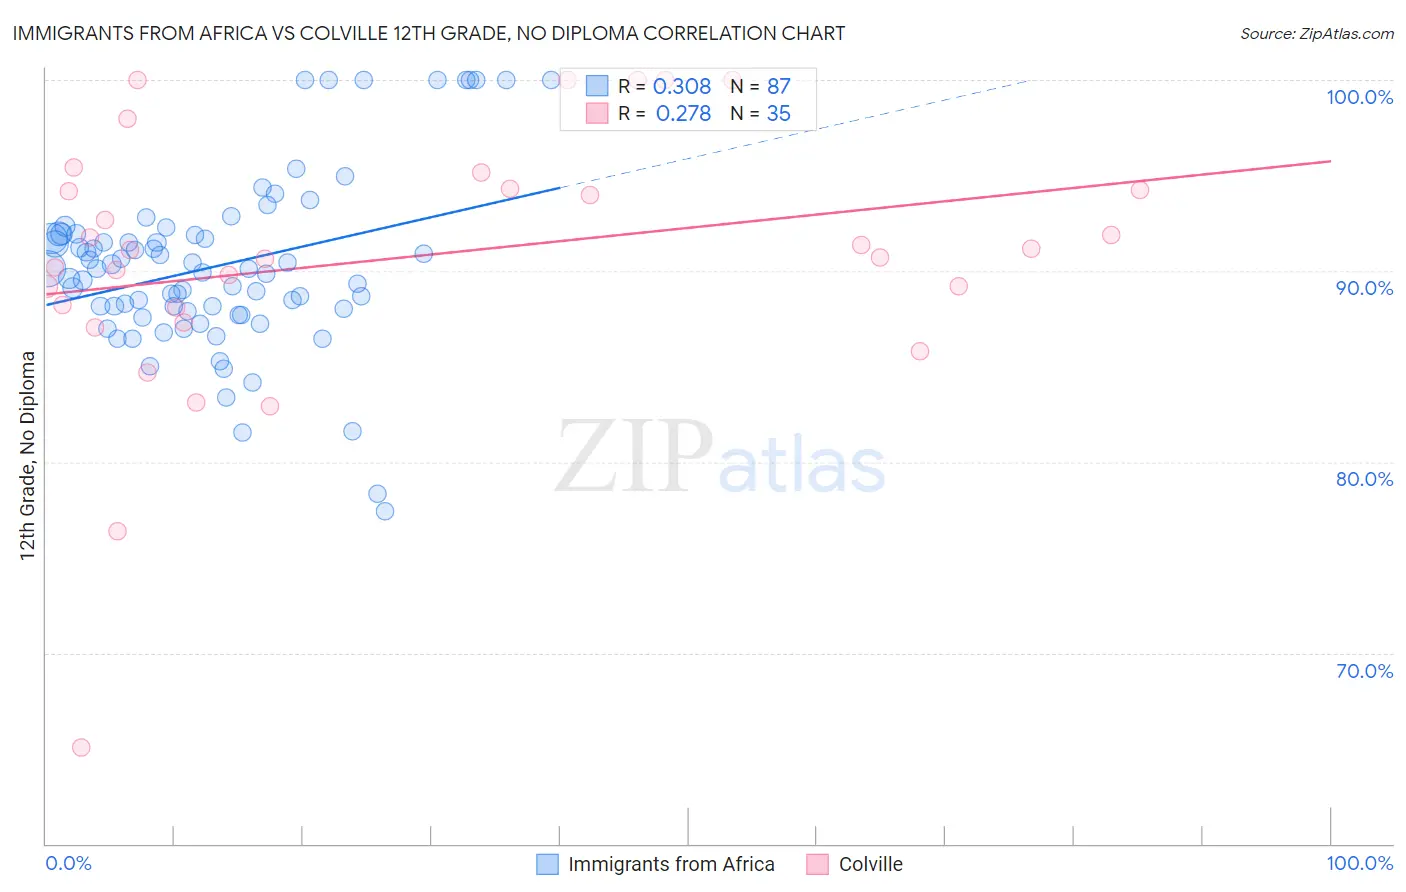
Immigrants from Africa vs Colville 12th Grade, No Diploma Correlation Chart
The statistical analysis conducted on geographies consisting of 469,408,443 people shows a mild positive correlation between the proportion of Immigrants from Africa and percentage of population with at least 12th grade (no diploma) education in the United States with a correlation coefficient (R) of 0.308 and weighted average of 90.5%. Similarly, the statistical analysis conducted on geographies consisting of 34,687,943 people shows a weak positive correlation between the proportion of Colville and percentage of population with at least 12th grade (no diploma) education in the United States with a correlation coefficient (R) of 0.278 and weighted average of 90.1%, a difference of 0.43%.
12th Grade, No Diploma Correlation Summary
| Measurement | Immigrants from Africa | Colville |
| Minimum | 77.4% | 65.0% |
| Maximum | 100.0% | 100.0% |
| Range | 22.6% | 35.0% |
| Mean | 90.3% | 90.7% |
| Median | 90.1% | 91.1% |
| Interquartile 25% (IQ1) | 87.9% | 88.1% |
| Interquartile 75% (IQ3) | 91.9% | 94.3% |
| Interquartile Range (IQR) | 4.1% | 6.2% |
| Standard Deviation (Sample) | 4.6% | 7.0% |
| Standard Deviation (Population) | 4.6% | 6.9% |
Similar Demographics by 12th Grade, No Diploma
Demographics Similar to Immigrants from Africa by 12th Grade, No Diploma
In terms of 12th grade, no diploma, the demographic groups most similar to Immigrants from Africa are Costa Rican (90.5%, a difference of 0.030%), Arapaho (90.5%, a difference of 0.030%), Shoshone (90.5%, a difference of 0.040%), Cherokee (90.5%, a difference of 0.040%), and Immigrants from Cameroon (90.5%, a difference of 0.040%).
| Demographics | Rating | Rank | 12th Grade, No Diploma |
| Armenians | 11.6 /100 | #207 | Poor 90.6% |
| Immigrants | Micronesia | 11.0 /100 | #208 | Poor 90.6% |
| Immigrants | Afghanistan | 11.0 /100 | #209 | Poor 90.6% |
| South American Indians | 10.9 /100 | #210 | Poor 90.6% |
| Portuguese | 10.6 /100 | #211 | Poor 90.6% |
| Somalis | 10.2 /100 | #212 | Poor 90.6% |
| Costa Ricans | 9.4 /100 | #213 | Tragic 90.5% |
| Immigrants | Africa | 8.5 /100 | #214 | Tragic 90.5% |
| Arapaho | 7.7 /100 | #215 | Tragic 90.5% |
| Shoshone | 7.5 /100 | #216 | Tragic 90.5% |
| Cherokee | 7.4 /100 | #217 | Tragic 90.5% |
| Immigrants | Cameroon | 7.4 /100 | #218 | Tragic 90.5% |
| Uruguayans | 7.0 /100 | #219 | Tragic 90.4% |
| Colombians | 6.6 /100 | #220 | Tragic 90.4% |
| Immigrants | Liberia | 5.7 /100 | #221 | Tragic 90.4% |
Demographics Similar to Colville by 12th Grade, No Diploma
In terms of 12th grade, no diploma, the demographic groups most similar to Colville are Immigrants from Thailand (90.1%, a difference of 0.0%), Immigrants from South America (90.1%, a difference of 0.0%), Immigrants from Uzbekistan (90.1%, a difference of 0.0%), Blackfeet (90.1%, a difference of 0.020%), and Immigrants from Colombia (90.1%, a difference of 0.030%).
| Demographics | Rating | Rank | 12th Grade, No Diploma |
| Creek | 3.9 /100 | #228 | Tragic 90.3% |
| Immigrants | Bahamas | 3.6 /100 | #229 | Tragic 90.2% |
| Immigrants | Philippines | 2.8 /100 | #230 | Tragic 90.2% |
| Peruvians | 2.7 /100 | #231 | Tragic 90.2% |
| Blackfeet | 2.4 /100 | #232 | Tragic 90.1% |
| Immigrants | Thailand | 2.3 /100 | #233 | Tragic 90.1% |
| Immigrants | South America | 2.3 /100 | #234 | Tragic 90.1% |
| Colville | 2.3 /100 | #235 | Tragic 90.1% |
| Immigrants | Uzbekistan | 2.2 /100 | #236 | Tragic 90.1% |
| Immigrants | Colombia | 2.1 /100 | #237 | Tragic 90.1% |
| Inupiat | 2.0 /100 | #238 | Tragic 90.1% |
| Sub-Saharan Africans | 1.9 /100 | #239 | Tragic 90.1% |
| Kiowa | 1.7 /100 | #240 | Tragic 90.0% |
| Immigrants | Middle Africa | 1.7 /100 | #241 | Tragic 90.0% |
| Immigrants | Costa Rica | 1.6 /100 | #242 | Tragic 90.0% |