Immigrants from Afghanistan vs Menominee Unemployment Among Ages 45 to 54 years
COMPARE
Immigrants from Afghanistan
Menominee
Unemployment Among Ages 45 to 54 years
Unemployment Among Ages 45 to 54 years Comparison
Immigrants from Afghanistan
Menominee
4.4%
UNEMPLOYMENT AMONG AGES 45 TO 54 YEARS
79.6/ 100
METRIC RATING
141st/ 347
METRIC RANK
5.3%
UNEMPLOYMENT AMONG AGES 45 TO 54 YEARS
0.0/ 100
METRIC RATING
301st/ 347
METRIC RANK
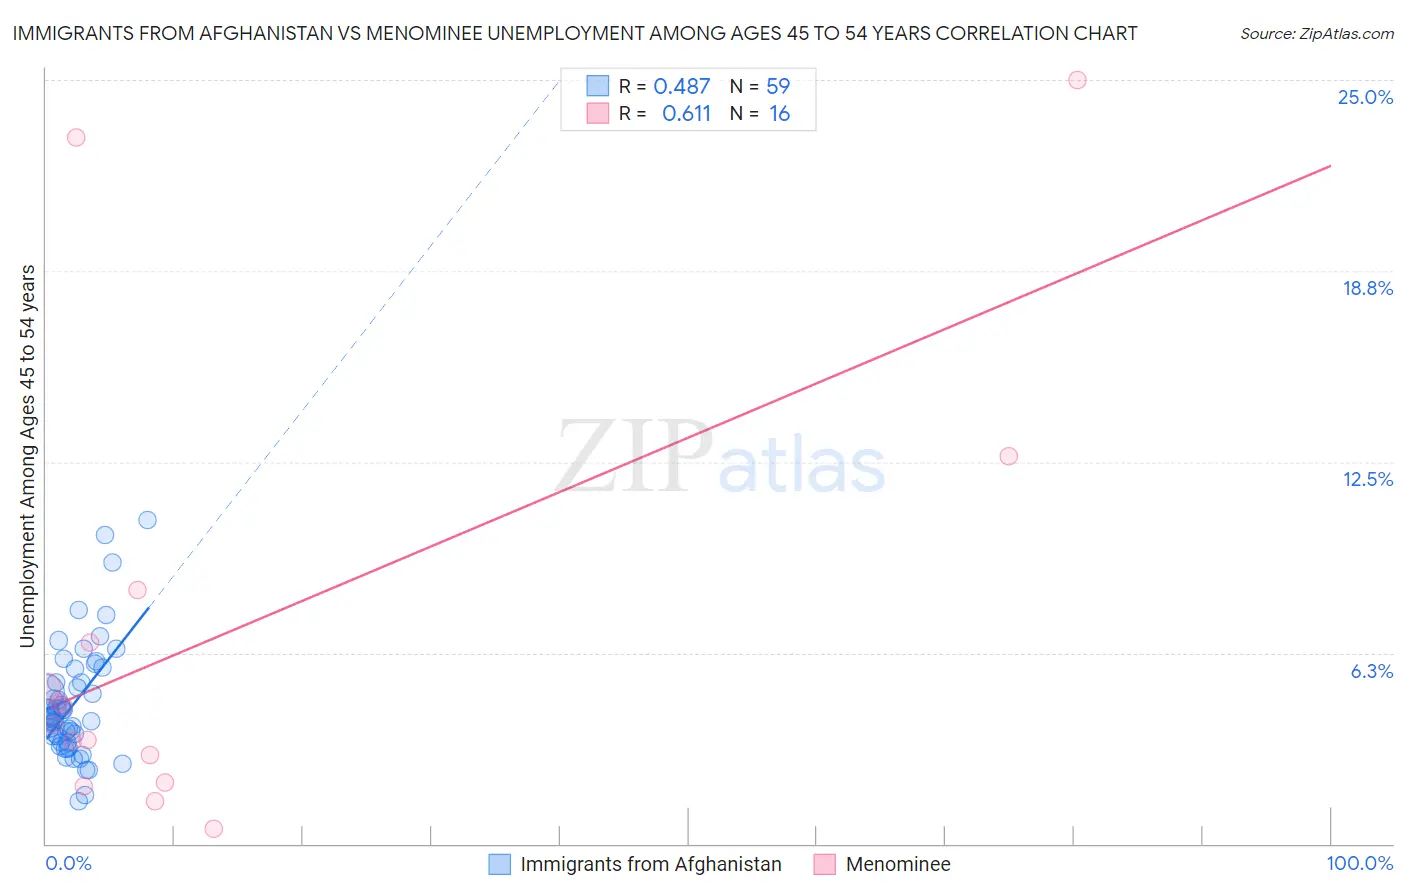
Immigrants from Afghanistan vs Menominee Unemployment Among Ages 45 to 54 years Correlation Chart
The statistical analysis conducted on geographies consisting of 146,637,469 people shows a moderate positive correlation between the proportion of Immigrants from Afghanistan and unemployment rate among population between the ages 45 and 54 in the United States with a correlation coefficient (R) of 0.487 and weighted average of 4.4%. Similarly, the statistical analysis conducted on geographies consisting of 45,287,300 people shows a significant positive correlation between the proportion of Menominee and unemployment rate among population between the ages 45 and 54 in the United States with a correlation coefficient (R) of 0.611 and weighted average of 5.3%, a difference of 19.0%.
Unemployment Among Ages 45 to 54 years Correlation Summary
| Measurement | Immigrants from Afghanistan | Menominee |
| Minimum | 1.4% | 0.50% |
| Maximum | 10.6% | 25.0% |
| Range | 9.2% | 24.5% |
| Mean | 4.6% | 6.8% |
| Median | 4.2% | 4.2% |
| Interquartile 25% (IQ1) | 3.3% | 2.5% |
| Interquartile 75% (IQ3) | 5.3% | 7.4% |
| Interquartile Range (IQR) | 2.0% | 5.0% |
| Standard Deviation (Sample) | 1.8% | 7.3% |
| Standard Deviation (Population) | 1.8% | 7.1% |
Similar Demographics by Unemployment Among Ages 45 to 54 years
Demographics Similar to Immigrants from Afghanistan by Unemployment Among Ages 45 to 54 years
In terms of unemployment among ages 45 to 54 years, the demographic groups most similar to Immigrants from Afghanistan are Immigrants from Netherlands (4.4%, a difference of 0.020%), Macedonian (4.5%, a difference of 0.040%), Immigrants from Zaire (4.4%, a difference of 0.080%), Taiwanese (4.5%, a difference of 0.12%), and Immigrants from Latvia (4.5%, a difference of 0.15%).
| Demographics | Rating | Rank | Unemployment Among Ages 45 to 54 years |
| Afghans | 84.6 /100 | #134 | Excellent 4.4% |
| Immigrants | Eastern Asia | 84.0 /100 | #135 | Excellent 4.4% |
| Immigrants | Middle Africa | 83.3 /100 | #136 | Excellent 4.4% |
| Lebanese | 81.9 /100 | #137 | Excellent 4.4% |
| Immigrants | Congo | 81.8 /100 | #138 | Excellent 4.4% |
| Immigrants | Kuwait | 81.7 /100 | #139 | Excellent 4.4% |
| Immigrants | Zaire | 80.7 /100 | #140 | Excellent 4.4% |
| Immigrants | Afghanistan | 79.6 /100 | #141 | Good 4.4% |
| Immigrants | Netherlands | 79.4 /100 | #142 | Good 4.4% |
| Macedonians | 79.0 /100 | #143 | Good 4.5% |
| Taiwanese | 77.9 /100 | #144 | Good 4.5% |
| Immigrants | Latvia | 77.5 /100 | #145 | Good 4.5% |
| Syrians | 77.3 /100 | #146 | Good 4.5% |
| Uruguayans | 76.9 /100 | #147 | Good 4.5% |
| Immigrants | Austria | 75.3 /100 | #148 | Good 4.5% |
Demographics Similar to Menominee by Unemployment Among Ages 45 to 54 years
In terms of unemployment among ages 45 to 54 years, the demographic groups most similar to Menominee are Central American Indian (5.3%, a difference of 0.21%), Ecuadorian (5.3%, a difference of 0.42%), Immigrants from Trinidad and Tobago (5.3%, a difference of 0.44%), Aleut (5.3%, a difference of 0.56%), and West Indian (5.3%, a difference of 0.56%).
| Demographics | Rating | Rank | Unemployment Among Ages 45 to 54 years |
| Belizeans | 0.0 /100 | #294 | Tragic 5.2% |
| Jamaicans | 0.0 /100 | #295 | Tragic 5.3% |
| Aleuts | 0.0 /100 | #296 | Tragic 5.3% |
| West Indians | 0.0 /100 | #297 | Tragic 5.3% |
| Immigrants | Trinidad and Tobago | 0.0 /100 | #298 | Tragic 5.3% |
| Ecuadorians | 0.0 /100 | #299 | Tragic 5.3% |
| Central American Indians | 0.0 /100 | #300 | Tragic 5.3% |
| Menominee | 0.0 /100 | #301 | Tragic 5.3% |
| Immigrants | Ecuador | 0.0 /100 | #302 | Tragic 5.3% |
| Immigrants | Belize | 0.0 /100 | #303 | Tragic 5.3% |
| Immigrants | Jamaica | 0.0 /100 | #304 | Tragic 5.4% |
| Immigrants | West Indies | 0.0 /100 | #305 | Tragic 5.4% |
| Immigrants | Bangladesh | 0.0 /100 | #306 | Tragic 5.4% |
| Vietnamese | 0.0 /100 | #307 | Tragic 5.4% |
| Blacks/African Americans | 0.0 /100 | #308 | Tragic 5.4% |