Icelander vs Immigrants from Kazakhstan Cognitive Disability
COMPARE
Icelander
Immigrants from Kazakhstan
Cognitive Disability
Cognitive Disability Comparison
Icelanders
Immigrants from Kazakhstan
17.6%
COGNITIVE DISABILITY
6.4/ 100
METRIC RATING
218th/ 347
METRIC RANK
17.1%
COGNITIVE DISABILITY
80.5/ 100
METRIC RATING
153rd/ 347
METRIC RANK
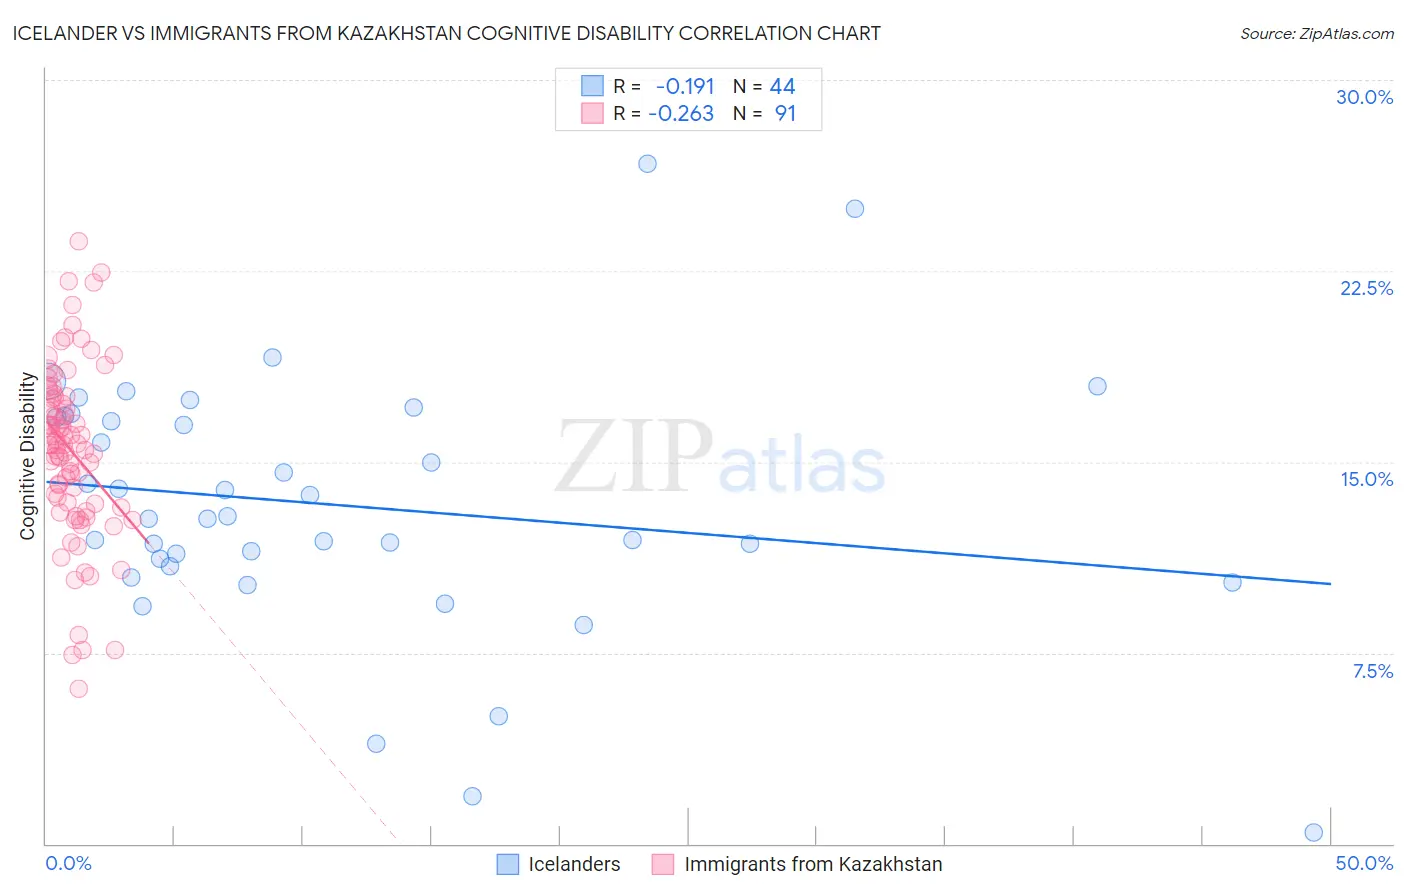
Icelander vs Immigrants from Kazakhstan Cognitive Disability Correlation Chart
The statistical analysis conducted on geographies consisting of 159,644,345 people shows a poor negative correlation between the proportion of Icelanders and percentage of population with cognitive disability in the United States with a correlation coefficient (R) of -0.191 and weighted average of 17.6%. Similarly, the statistical analysis conducted on geographies consisting of 124,443,744 people shows a weak negative correlation between the proportion of Immigrants from Kazakhstan and percentage of population with cognitive disability in the United States with a correlation coefficient (R) of -0.263 and weighted average of 17.1%, a difference of 2.9%.
Cognitive Disability Correlation Summary
| Measurement | Icelander | Immigrants from Kazakhstan |
| Minimum | 0.44% | 6.1% |
| Maximum | 26.7% | 23.7% |
| Range | 26.3% | 17.6% |
| Mean | 13.3% | 15.5% |
| Median | 12.8% | 15.7% |
| Interquartile 25% (IQ1) | 11.0% | 13.4% |
| Interquartile 75% (IQ3) | 16.8% | 17.5% |
| Interquartile Range (IQR) | 5.7% | 4.2% |
| Standard Deviation (Sample) | 5.1% | 3.4% |
| Standard Deviation (Population) | 5.0% | 3.4% |
Similar Demographics by Cognitive Disability
Demographics Similar to Icelanders by Cognitive Disability
In terms of cognitive disability, the demographic groups most similar to Icelanders are Immigrants from Sierra Leone (17.6%, a difference of 0.010%), Salvadoran (17.6%, a difference of 0.030%), Zimbabwean (17.6%, a difference of 0.040%), Okinawan (17.6%, a difference of 0.050%), and Moroccan (17.6%, a difference of 0.050%).
| Demographics | Rating | Rank | Cognitive Disability |
| Taiwanese | 7.7 /100 | #211 | Tragic 17.6% |
| Immigrants | Oceania | 7.3 /100 | #212 | Tragic 17.6% |
| Hawaiians | 7.2 /100 | #213 | Tragic 17.6% |
| Immigrants | El Salvador | 7.0 /100 | #214 | Tragic 17.6% |
| Alaskan Athabascans | 6.9 /100 | #215 | Tragic 17.6% |
| Okinawans | 6.8 /100 | #216 | Tragic 17.6% |
| Salvadorans | 6.7 /100 | #217 | Tragic 17.6% |
| Icelanders | 6.4 /100 | #218 | Tragic 17.6% |
| Immigrants | Sierra Leone | 6.3 /100 | #219 | Tragic 17.6% |
| Zimbabweans | 6.1 /100 | #220 | Tragic 17.6% |
| Moroccans | 5.9 /100 | #221 | Tragic 17.6% |
| Central Americans | 4.5 /100 | #222 | Tragic 17.7% |
| Alsatians | 4.5 /100 | #223 | Tragic 17.7% |
| Fijians | 3.4 /100 | #224 | Tragic 17.7% |
| Vietnamese | 3.4 /100 | #225 | Tragic 17.7% |
Demographics Similar to Immigrants from Kazakhstan by Cognitive Disability
In terms of cognitive disability, the demographic groups most similar to Immigrants from Kazakhstan are Immigrants from Malaysia (17.1%, a difference of 0.050%), Brazilian (17.1%, a difference of 0.070%), Sri Lankan (17.1%, a difference of 0.070%), Immigrants from Indonesia (17.1%, a difference of 0.10%), and Syrian (17.1%, a difference of 0.12%).
| Demographics | Rating | Rank | Cognitive Disability |
| Costa Ricans | 88.0 /100 | #146 | Excellent 17.0% |
| Scotch-Irish | 85.9 /100 | #147 | Excellent 17.1% |
| French Canadians | 85.7 /100 | #148 | Excellent 17.1% |
| Cypriots | 85.7 /100 | #149 | Excellent 17.1% |
| Basques | 85.5 /100 | #150 | Excellent 17.1% |
| Syrians | 83.0 /100 | #151 | Excellent 17.1% |
| Immigrants | Indonesia | 82.7 /100 | #152 | Excellent 17.1% |
| Immigrants | Kazakhstan | 80.5 /100 | #153 | Excellent 17.1% |
| Immigrants | Malaysia | 79.3 /100 | #154 | Good 17.1% |
| Brazilians | 78.9 /100 | #155 | Good 17.1% |
| Sri Lankans | 78.9 /100 | #156 | Good 17.1% |
| Immigrants | Australia | 76.0 /100 | #157 | Good 17.1% |
| Celtics | 74.1 /100 | #158 | Good 17.1% |
| Immigrants | Latvia | 73.2 /100 | #159 | Good 17.2% |
| Australians | 72.4 /100 | #160 | Good 17.2% |