Icelander vs Immigrants from Kazakhstan Unemployment Among Seniors over 75 years
COMPARE
Icelander
Immigrants from Kazakhstan
Unemployment Among Seniors over 75 years
Unemployment Among Seniors over 75 years Comparison
Icelanders
Immigrants from Kazakhstan
7.0%
UNEMPLOYMENT AMONG SENIORS OVER 75 YEARS
100.0/ 100
METRIC RATING
15th/ 347
METRIC RANK
8.2%
UNEMPLOYMENT AMONG SENIORS OVER 75 YEARS
99.2/ 100
METRIC RATING
100th/ 347
METRIC RANK
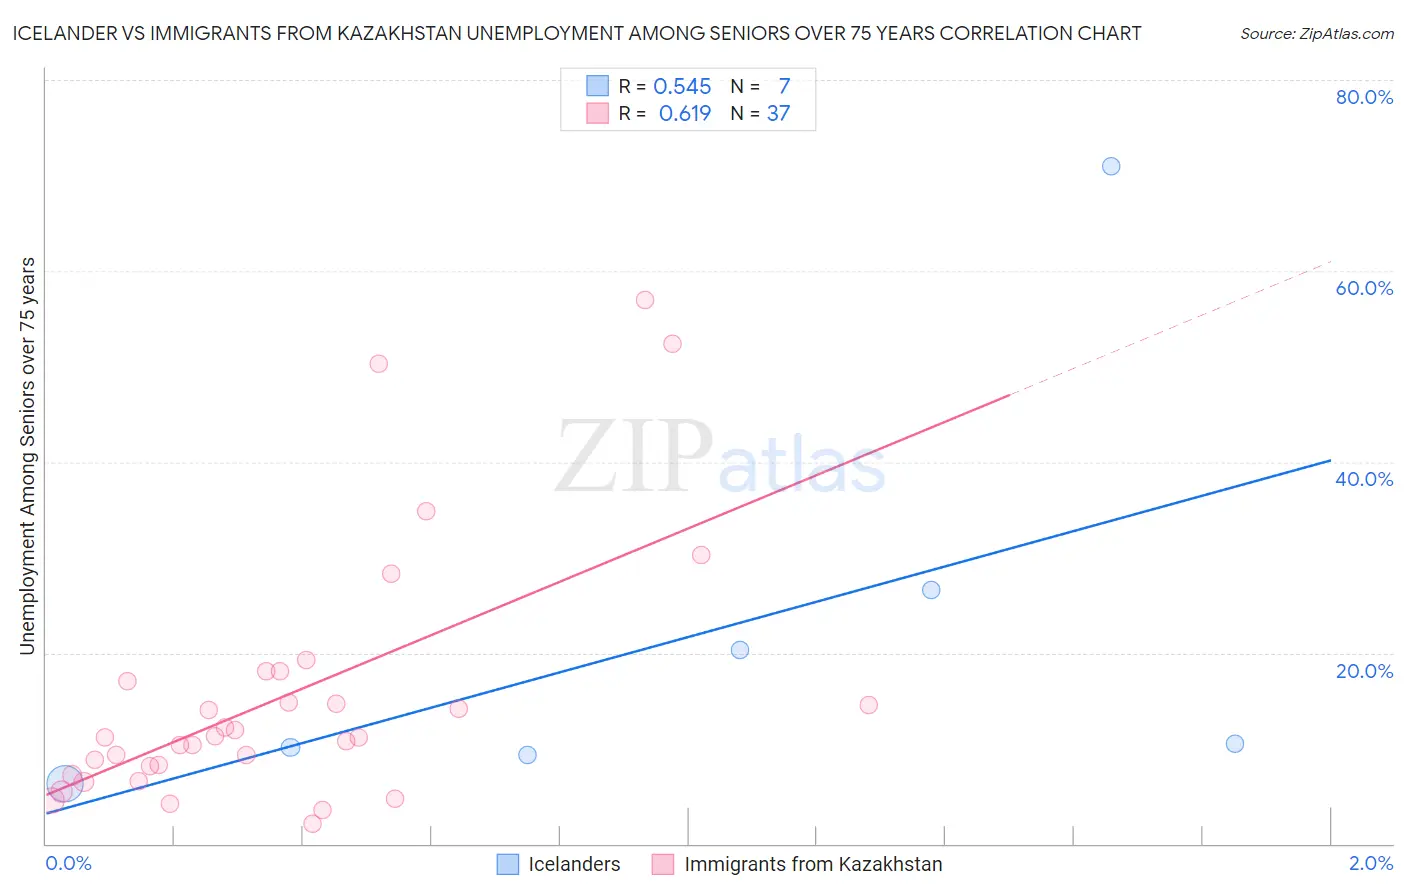
Icelander vs Immigrants from Kazakhstan Unemployment Among Seniors over 75 years Correlation Chart
The statistical analysis conducted on geographies consisting of 106,583,588 people shows a substantial positive correlation between the proportion of Icelanders and unemployment rate among seniors over the age of 75 in the United States with a correlation coefficient (R) of 0.545 and weighted average of 7.0%. Similarly, the statistical analysis conducted on geographies consisting of 87,895,978 people shows a significant positive correlation between the proportion of Immigrants from Kazakhstan and unemployment rate among seniors over the age of 75 in the United States with a correlation coefficient (R) of 0.619 and weighted average of 8.2%, a difference of 16.3%.
Unemployment Among Seniors over 75 years Correlation Summary
| Measurement | Icelander | Immigrants from Kazakhstan |
| Minimum | 6.3% | 2.1% |
| Maximum | 70.9% | 56.9% |
| Range | 64.6% | 54.8% |
| Mean | 22.0% | 15.5% |
| Median | 10.5% | 11.2% |
| Interquartile 25% (IQ1) | 9.3% | 7.7% |
| Interquartile 75% (IQ3) | 26.6% | 17.5% |
| Interquartile Range (IQR) | 17.3% | 9.9% |
| Standard Deviation (Sample) | 22.7% | 13.4% |
| Standard Deviation (Population) | 21.0% | 13.2% |
Similar Demographics by Unemployment Among Seniors over 75 years
Demographics Similar to Icelanders by Unemployment Among Seniors over 75 years
In terms of unemployment among seniors over 75 years, the demographic groups most similar to Icelanders are Seminole (7.1%, a difference of 1.3%), Immigrants from Switzerland (7.2%, a difference of 2.3%), Immigrants from Uzbekistan (7.2%, a difference of 2.6%), Immigrants from Zaire (7.2%, a difference of 2.7%), and Armenian (7.2%, a difference of 3.0%).
| Demographics | Rating | Rank | Unemployment Among Seniors over 75 years |
| Taiwanese | 100.0 /100 | #8 | Exceptional 6.6% |
| Soviet Union | 100.0 /100 | #9 | Exceptional 6.6% |
| Yuman | 100.0 /100 | #10 | Exceptional 6.7% |
| Immigrants | Grenada | 100.0 /100 | #11 | Exceptional 6.7% |
| Comanche | 100.0 /100 | #12 | Exceptional 6.7% |
| Immigrants | Congo | 100.0 /100 | #13 | Exceptional 6.7% |
| Ute | 100.0 /100 | #14 | Exceptional 6.8% |
| Icelanders | 100.0 /100 | #15 | Exceptional 7.0% |
| Seminole | 100.0 /100 | #16 | Exceptional 7.1% |
| Immigrants | Switzerland | 100.0 /100 | #17 | Exceptional 7.2% |
| Immigrants | Uzbekistan | 100.0 /100 | #18 | Exceptional 7.2% |
| Immigrants | Zaire | 100.0 /100 | #19 | Exceptional 7.2% |
| Armenians | 100.0 /100 | #20 | Exceptional 7.2% |
| Chickasaw | 100.0 /100 | #21 | Exceptional 7.3% |
| Cypriots | 100.0 /100 | #22 | Exceptional 7.4% |
Demographics Similar to Immigrants from Kazakhstan by Unemployment Among Seniors over 75 years
In terms of unemployment among seniors over 75 years, the demographic groups most similar to Immigrants from Kazakhstan are Burmese (8.2%, a difference of 0.010%), Immigrants from Serbia (8.2%, a difference of 0.050%), Immigrants from Northern Africa (8.2%, a difference of 0.10%), Immigrants from Sri Lanka (8.2%, a difference of 0.14%), and Immigrants from Panama (8.2%, a difference of 0.14%).
| Demographics | Rating | Rank | Unemployment Among Seniors over 75 years |
| Immigrants | Netherlands | 99.5 /100 | #93 | Exceptional 8.1% |
| Immigrants | Ireland | 99.4 /100 | #94 | Exceptional 8.1% |
| Nicaraguans | 99.3 /100 | #95 | Exceptional 8.2% |
| Immigrants | Belgium | 99.3 /100 | #96 | Exceptional 8.2% |
| Immigrants | Sri Lanka | 99.3 /100 | #97 | Exceptional 8.2% |
| Immigrants | Northern Africa | 99.3 /100 | #98 | Exceptional 8.2% |
| Burmese | 99.2 /100 | #99 | Exceptional 8.2% |
| Immigrants | Kazakhstan | 99.2 /100 | #100 | Exceptional 8.2% |
| Immigrants | Serbia | 99.2 /100 | #101 | Exceptional 8.2% |
| Immigrants | Panama | 99.1 /100 | #102 | Exceptional 8.2% |
| South American Indians | 99.1 /100 | #103 | Exceptional 8.2% |
| Immigrants | South Central Asia | 99.0 /100 | #104 | Exceptional 8.2% |
| Immigrants | Caribbean | 99.0 /100 | #105 | Exceptional 8.2% |
| Immigrants | Honduras | 99.0 /100 | #106 | Exceptional 8.2% |
| Sri Lankans | 98.9 /100 | #107 | Exceptional 8.2% |