Houma vs Immigrants from Albania Disability Age Over 75
COMPARE
Houma
Immigrants from Albania
Disability Age Over 75
Disability Age Over 75 Comparison
Houma
Immigrants from Albania
56.2%
DISABILITY AGE OVER 75
0.0/ 100
METRIC RATING
341st/ 347
METRIC RANK
46.6%
DISABILITY AGE OVER 75
93.2/ 100
METRIC RATING
122nd/ 347
METRIC RANK
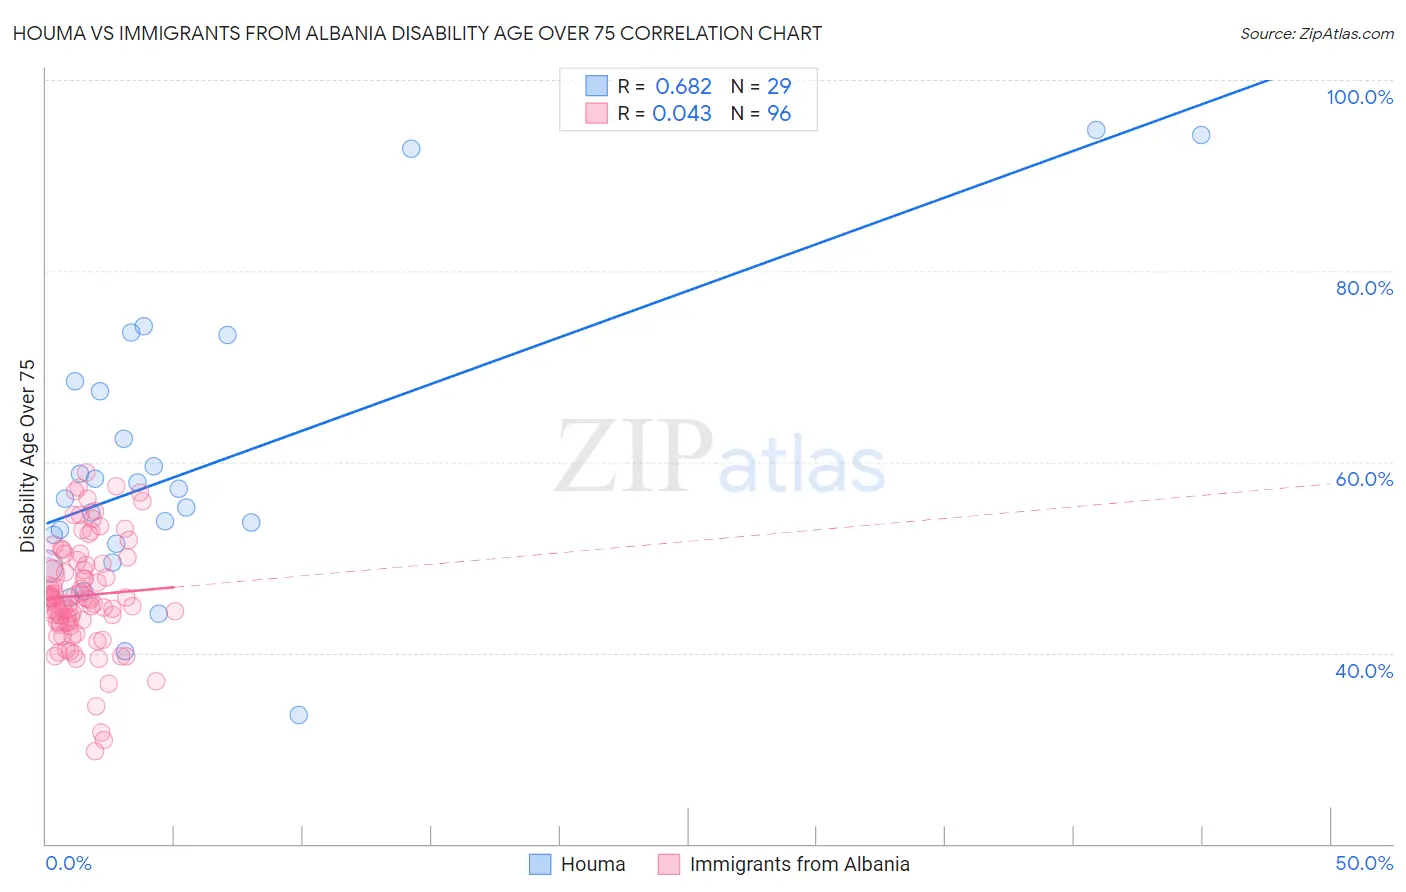
Houma vs Immigrants from Albania Disability Age Over 75 Correlation Chart
The statistical analysis conducted on geographies consisting of 36,766,477 people shows a significant positive correlation between the proportion of Houma and percentage of population with a disability over the age of 75 in the United States with a correlation coefficient (R) of 0.682 and weighted average of 56.2%. Similarly, the statistical analysis conducted on geographies consisting of 119,350,943 people shows no correlation between the proportion of Immigrants from Albania and percentage of population with a disability over the age of 75 in the United States with a correlation coefficient (R) of 0.043 and weighted average of 46.6%, a difference of 20.4%.
Disability Age Over 75 Correlation Summary
| Measurement | Houma | Immigrants from Albania |
| Minimum | 33.5% | 29.7% |
| Maximum | 94.7% | 58.9% |
| Range | 61.3% | 29.2% |
| Mean | 59.7% | 46.0% |
| Median | 56.1% | 45.6% |
| Interquartile 25% (IQ1) | 50.4% | 43.1% |
| Interquartile 75% (IQ3) | 67.9% | 49.5% |
| Interquartile Range (IQR) | 17.5% | 6.3% |
| Standard Deviation (Sample) | 15.2% | 5.8% |
| Standard Deviation (Population) | 14.9% | 5.8% |
Similar Demographics by Disability Age Over 75
Demographics Similar to Houma by Disability Age Over 75
In terms of disability age over 75, the demographic groups most similar to Houma are Lumbee (56.2%, a difference of 0.16%), Pueblo (55.9%, a difference of 0.51%), Pima (55.8%, a difference of 0.59%), Tohono O'odham (56.7%, a difference of 1.0%), and Colville (55.4%, a difference of 1.4%).
| Demographics | Rating | Rank | Disability Age Over 75 |
| Apache | 0.0 /100 | #333 | Tragic 53.6% |
| Alaskan Athabascans | 0.0 /100 | #334 | Tragic 54.0% |
| Kiowa | 0.0 /100 | #335 | Tragic 54.2% |
| Immigrants | Armenia | 0.0 /100 | #336 | Tragic 54.3% |
| Yuman | 0.0 /100 | #337 | Tragic 54.4% |
| Colville | 0.0 /100 | #338 | Tragic 55.4% |
| Pima | 0.0 /100 | #339 | Tragic 55.8% |
| Pueblo | 0.0 /100 | #340 | Tragic 55.9% |
| Houma | 0.0 /100 | #341 | Tragic 56.2% |
| Lumbee | 0.0 /100 | #342 | Tragic 56.2% |
| Tohono O'odham | 0.0 /100 | #343 | Tragic 56.7% |
| Navajo | 0.0 /100 | #344 | Tragic 58.3% |
| Inupiat | 0.0 /100 | #345 | Tragic 58.4% |
| Tsimshian | 0.0 /100 | #346 | Tragic 59.2% |
| Yup'ik | 0.0 /100 | #347 | Tragic 61.1% |
Demographics Similar to Immigrants from Albania by Disability Age Over 75
In terms of disability age over 75, the demographic groups most similar to Immigrants from Albania are Scandinavian (46.6%, a difference of 0.050%), Immigrants from Colombia (46.7%, a difference of 0.050%), Immigrants from Nepal (46.6%, a difference of 0.090%), Immigrants from South America (46.7%, a difference of 0.11%), and Canadian (46.6%, a difference of 0.12%).
| Demographics | Rating | Rank | Disability Age Over 75 |
| British | 95.7 /100 | #115 | Exceptional 46.5% |
| Indians (Asian) | 95.7 /100 | #116 | Exceptional 46.5% |
| Hungarians | 95.3 /100 | #117 | Exceptional 46.5% |
| Czechoslovakians | 94.7 /100 | #118 | Exceptional 46.6% |
| Canadians | 94.4 /100 | #119 | Exceptional 46.6% |
| Immigrants | Nepal | 94.1 /100 | #120 | Exceptional 46.6% |
| Scandinavians | 93.6 /100 | #121 | Exceptional 46.6% |
| Immigrants | Albania | 93.2 /100 | #122 | Exceptional 46.6% |
| Immigrants | Colombia | 92.6 /100 | #123 | Exceptional 46.7% |
| Immigrants | South America | 91.8 /100 | #124 | Exceptional 46.7% |
| Colombians | 91.3 /100 | #125 | Exceptional 46.7% |
| Europeans | 91.2 /100 | #126 | Exceptional 46.7% |
| Syrians | 91.1 /100 | #127 | Exceptional 46.7% |
| Icelanders | 90.9 /100 | #128 | Exceptional 46.7% |
| Immigrants | Germany | 90.8 /100 | #129 | Exceptional 46.7% |