Spanish American Indian vs Immigrants from Albania Disability Age Over 75
COMPARE
Spanish American Indian
Immigrants from Albania
Disability Age Over 75
Disability Age Over 75 Comparison
Spanish American Indians
Immigrants from Albania
49.9%
DISABILITY AGE OVER 75
0.0/ 100
METRIC RATING
293rd/ 347
METRIC RANK
46.6%
DISABILITY AGE OVER 75
93.2/ 100
METRIC RATING
122nd/ 347
METRIC RANK
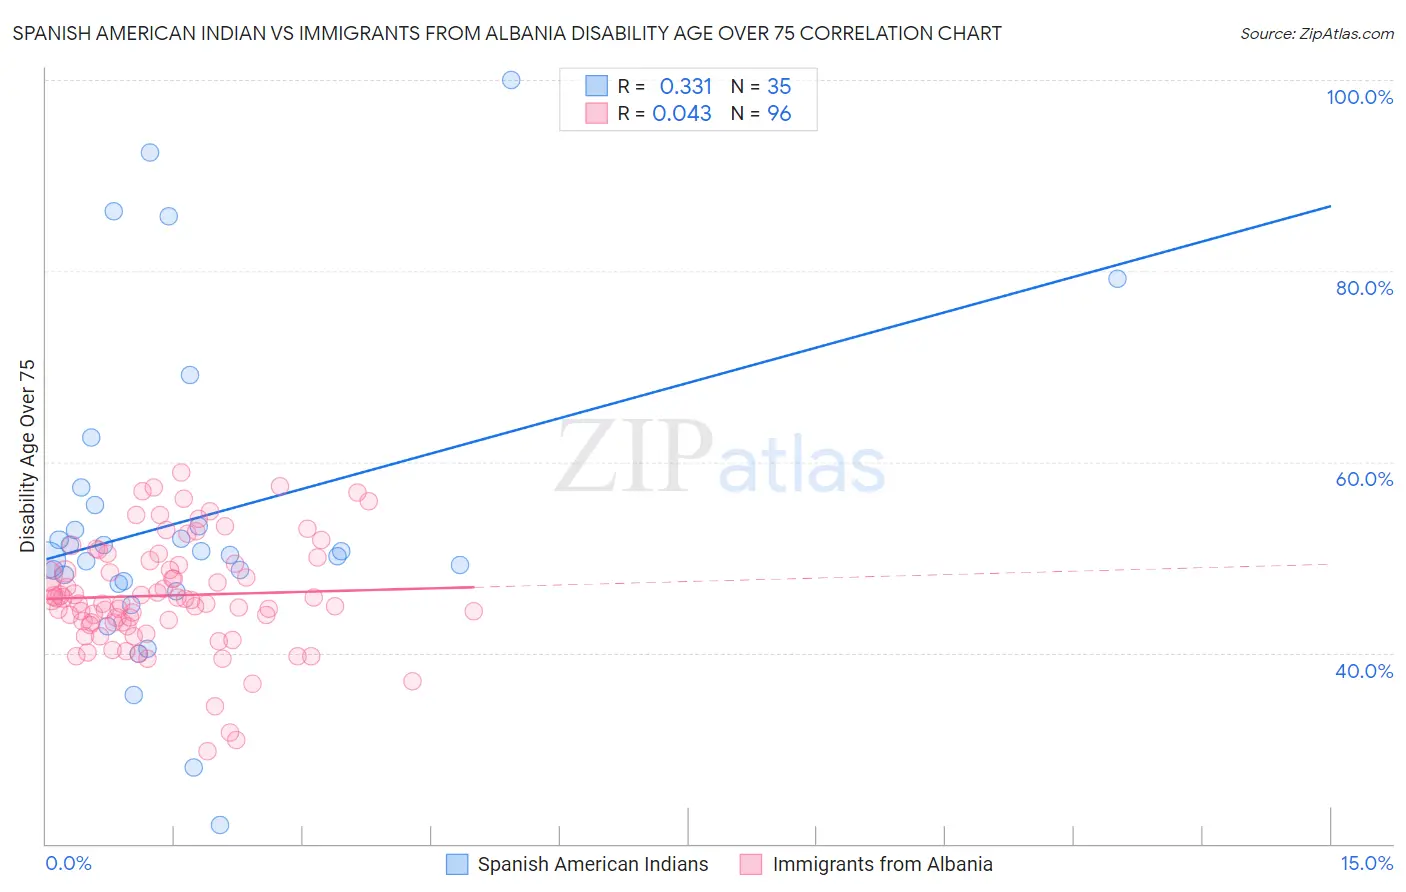
Spanish American Indian vs Immigrants from Albania Disability Age Over 75 Correlation Chart
The statistical analysis conducted on geographies consisting of 73,138,500 people shows a mild positive correlation between the proportion of Spanish American Indians and percentage of population with a disability over the age of 75 in the United States with a correlation coefficient (R) of 0.331 and weighted average of 49.9%. Similarly, the statistical analysis conducted on geographies consisting of 119,350,943 people shows no correlation between the proportion of Immigrants from Albania and percentage of population with a disability over the age of 75 in the United States with a correlation coefficient (R) of 0.043 and weighted average of 46.6%, a difference of 7.0%.
Disability Age Over 75 Correlation Summary
| Measurement | Spanish American Indian | Immigrants from Albania |
| Minimum | 22.0% | 29.7% |
| Maximum | 100.0% | 58.9% |
| Range | 78.0% | 29.2% |
| Mean | 54.0% | 46.0% |
| Median | 50.2% | 45.6% |
| Interquartile 25% (IQ1) | 47.3% | 43.1% |
| Interquartile 75% (IQ3) | 55.5% | 49.5% |
| Interquartile Range (IQR) | 8.2% | 6.3% |
| Standard Deviation (Sample) | 16.8% | 5.8% |
| Standard Deviation (Population) | 16.6% | 5.8% |
Similar Demographics by Disability Age Over 75
Demographics Similar to Spanish American Indians by Disability Age Over 75
In terms of disability age over 75, the demographic groups most similar to Spanish American Indians are Immigrants from Cambodia (50.0%, a difference of 0.12%), Shoshone (49.9%, a difference of 0.15%), Spanish American (50.0%, a difference of 0.16%), Mexican American Indian (50.0%, a difference of 0.19%), and Arapaho (49.8%, a difference of 0.22%).
| Demographics | Rating | Rank | Disability Age Over 75 |
| Immigrants | Belize | 0.0 /100 | #286 | Tragic 49.6% |
| Sioux | 0.0 /100 | #287 | Tragic 49.7% |
| Yaqui | 0.0 /100 | #288 | Tragic 49.8% |
| Osage | 0.0 /100 | #289 | Tragic 49.8% |
| Puget Sound Salish | 0.0 /100 | #290 | Tragic 49.8% |
| Arapaho | 0.0 /100 | #291 | Tragic 49.8% |
| Shoshone | 0.0 /100 | #292 | Tragic 49.9% |
| Spanish American Indians | 0.0 /100 | #293 | Tragic 49.9% |
| Immigrants | Cambodia | 0.0 /100 | #294 | Tragic 50.0% |
| Spanish Americans | 0.0 /100 | #295 | Tragic 50.0% |
| Mexican American Indians | 0.0 /100 | #296 | Tragic 50.0% |
| Armenians | 0.0 /100 | #297 | Tragic 50.0% |
| Marshallese | 0.0 /100 | #298 | Tragic 50.1% |
| Immigrants | Micronesia | 0.0 /100 | #299 | Tragic 50.1% |
| Cape Verdeans | 0.0 /100 | #300 | Tragic 50.1% |
Demographics Similar to Immigrants from Albania by Disability Age Over 75
In terms of disability age over 75, the demographic groups most similar to Immigrants from Albania are Scandinavian (46.6%, a difference of 0.050%), Immigrants from Colombia (46.7%, a difference of 0.050%), Immigrants from Nepal (46.6%, a difference of 0.090%), Immigrants from South America (46.7%, a difference of 0.11%), and Canadian (46.6%, a difference of 0.12%).
| Demographics | Rating | Rank | Disability Age Over 75 |
| British | 95.7 /100 | #115 | Exceptional 46.5% |
| Indians (Asian) | 95.7 /100 | #116 | Exceptional 46.5% |
| Hungarians | 95.3 /100 | #117 | Exceptional 46.5% |
| Czechoslovakians | 94.7 /100 | #118 | Exceptional 46.6% |
| Canadians | 94.4 /100 | #119 | Exceptional 46.6% |
| Immigrants | Nepal | 94.1 /100 | #120 | Exceptional 46.6% |
| Scandinavians | 93.6 /100 | #121 | Exceptional 46.6% |
| Immigrants | Albania | 93.2 /100 | #122 | Exceptional 46.6% |
| Immigrants | Colombia | 92.6 /100 | #123 | Exceptional 46.7% |
| Immigrants | South America | 91.8 /100 | #124 | Exceptional 46.7% |
| Colombians | 91.3 /100 | #125 | Exceptional 46.7% |
| Europeans | 91.2 /100 | #126 | Exceptional 46.7% |
| Syrians | 91.1 /100 | #127 | Exceptional 46.7% |
| Icelanders | 90.9 /100 | #128 | Exceptional 46.7% |
| Immigrants | Germany | 90.8 /100 | #129 | Exceptional 46.7% |