Hmong vs Immigrants from Cameroon Disability Age Over 75
COMPARE
Hmong
Immigrants from Cameroon
Disability Age Over 75
Disability Age Over 75 Comparison
Hmong
Immigrants from Cameroon
48.2%
DISABILITY AGE OVER 75
3.8/ 100
METRIC RATING
235th/ 347
METRIC RANK
46.4%
DISABILITY AGE OVER 75
96.9/ 100
METRIC RATING
105th/ 347
METRIC RANK
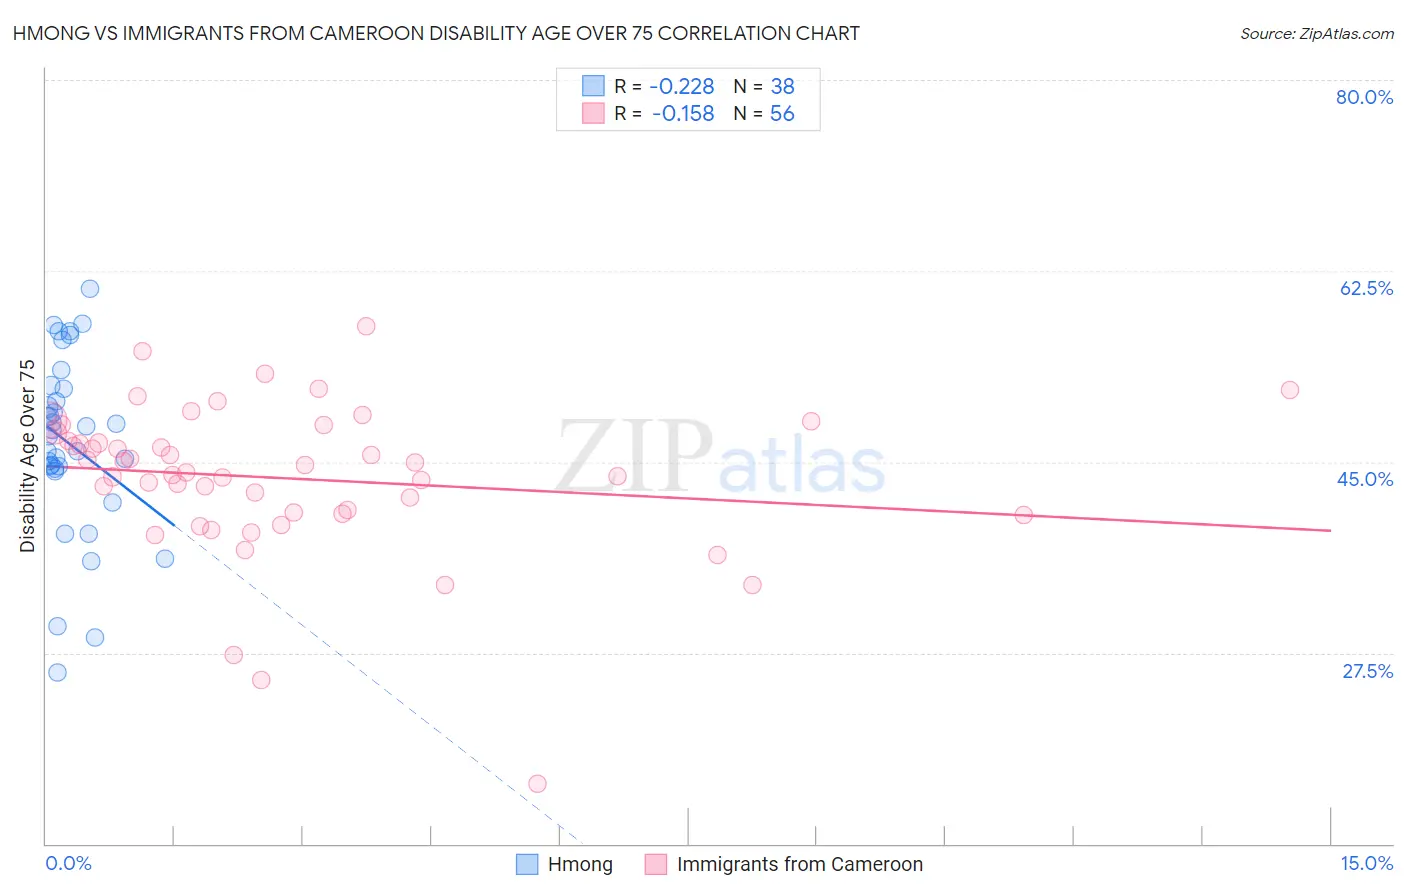
Hmong vs Immigrants from Cameroon Disability Age Over 75 Correlation Chart
The statistical analysis conducted on geographies consisting of 24,677,654 people shows a weak negative correlation between the proportion of Hmong and percentage of population with a disability over the age of 75 in the United States with a correlation coefficient (R) of -0.228 and weighted average of 48.2%. Similarly, the statistical analysis conducted on geographies consisting of 130,611,949 people shows a poor negative correlation between the proportion of Immigrants from Cameroon and percentage of population with a disability over the age of 75 in the United States with a correlation coefficient (R) of -0.158 and weighted average of 46.4%, a difference of 3.8%.
Disability Age Over 75 Correlation Summary
| Measurement | Hmong | Immigrants from Cameroon |
| Minimum | 25.7% | 15.5% |
| Maximum | 60.8% | 57.5% |
| Range | 35.1% | 42.0% |
| Mean | 46.7% | 43.5% |
| Median | 47.7% | 44.4% |
| Interquartile 25% (IQ1) | 44.4% | 40.3% |
| Interquartile 75% (IQ3) | 51.8% | 47.3% |
| Interquartile Range (IQR) | 7.4% | 7.0% |
| Standard Deviation (Sample) | 8.2% | 7.1% |
| Standard Deviation (Population) | 8.0% | 7.0% |
Similar Demographics by Disability Age Over 75
Demographics Similar to Hmong by Disability Age Over 75
In terms of disability age over 75, the demographic groups most similar to Hmong are Subsaharan African (48.2%, a difference of 0.0%), Indonesian (48.2%, a difference of 0.070%), Cree (48.2%, a difference of 0.070%), Immigrants (48.2%, a difference of 0.080%), and Taiwanese (48.2%, a difference of 0.090%).
| Demographics | Rating | Rank | Disability Age Over 75 |
| Immigrants | Liberia | 5.9 /100 | #228 | Tragic 48.1% |
| Spaniards | 5.7 /100 | #229 | Tragic 48.1% |
| Taiwanese | 4.4 /100 | #230 | Tragic 48.2% |
| Immigrants | Immigrants | 4.3 /100 | #231 | Tragic 48.2% |
| Indonesians | 4.2 /100 | #232 | Tragic 48.2% |
| Cree | 4.2 /100 | #233 | Tragic 48.2% |
| Sub-Saharan Africans | 3.8 /100 | #234 | Tragic 48.2% |
| Hmong | 3.8 /100 | #235 | Tragic 48.2% |
| Immigrants | Nicaragua | 3.2 /100 | #236 | Tragic 48.2% |
| Immigrants | St. Vincent and the Grenadines | 3.2 /100 | #237 | Tragic 48.2% |
| Nicaraguans | 3.0 /100 | #238 | Tragic 48.3% |
| Immigrants | Thailand | 2.8 /100 | #239 | Tragic 48.3% |
| Tongans | 2.3 /100 | #240 | Tragic 48.3% |
| Native Hawaiians | 2.2 /100 | #241 | Tragic 48.3% |
| French American Indians | 2.2 /100 | #242 | Tragic 48.3% |
Demographics Similar to Immigrants from Cameroon by Disability Age Over 75
In terms of disability age over 75, the demographic groups most similar to Immigrants from Cameroon are Immigrants from Kuwait (46.4%, a difference of 0.010%), Israeli (46.4%, a difference of 0.020%), Ukrainian (46.4%, a difference of 0.040%), Immigrants from Malaysia (46.4%, a difference of 0.050%), and Immigrants from Uruguay (46.4%, a difference of 0.050%).
| Demographics | Rating | Rank | Disability Age Over 75 |
| Immigrants | Japan | 97.8 /100 | #98 | Exceptional 46.3% |
| Palestinians | 97.7 /100 | #99 | Exceptional 46.3% |
| Immigrants | Eastern Europe | 97.7 /100 | #100 | Exceptional 46.3% |
| Mongolians | 97.7 /100 | #101 | Exceptional 46.3% |
| Immigrants | Malaysia | 97.1 /100 | #102 | Exceptional 46.4% |
| Ukrainians | 97.1 /100 | #103 | Exceptional 46.4% |
| Israelis | 97.0 /100 | #104 | Exceptional 46.4% |
| Immigrants | Cameroon | 96.9 /100 | #105 | Exceptional 46.4% |
| Immigrants | Kuwait | 96.8 /100 | #106 | Exceptional 46.4% |
| Immigrants | Uruguay | 96.7 /100 | #107 | Exceptional 46.4% |
| Brazilians | 96.6 /100 | #108 | Exceptional 46.5% |
| Chileans | 96.4 /100 | #109 | Exceptional 46.5% |
| Immigrants | Hong Kong | 96.4 /100 | #110 | Exceptional 46.5% |
| Immigrants | Chile | 96.4 /100 | #111 | Exceptional 46.5% |
| Immigrants | Pakistan | 96.1 /100 | #112 | Exceptional 46.5% |