German vs Marshallese Disability Age 65 to 74
COMPARE
German
Marshallese
Disability Age 65 to 74
Disability Age 65 to 74 Comparison
Germans
Marshallese
23.3%
DISABILITY AGE 65 TO 74
50.5/ 100
METRIC RATING
172nd/ 347
METRIC RANK
25.3%
DISABILITY AGE 65 TO 74
0.3/ 100
METRIC RATING
258th/ 347
METRIC RANK
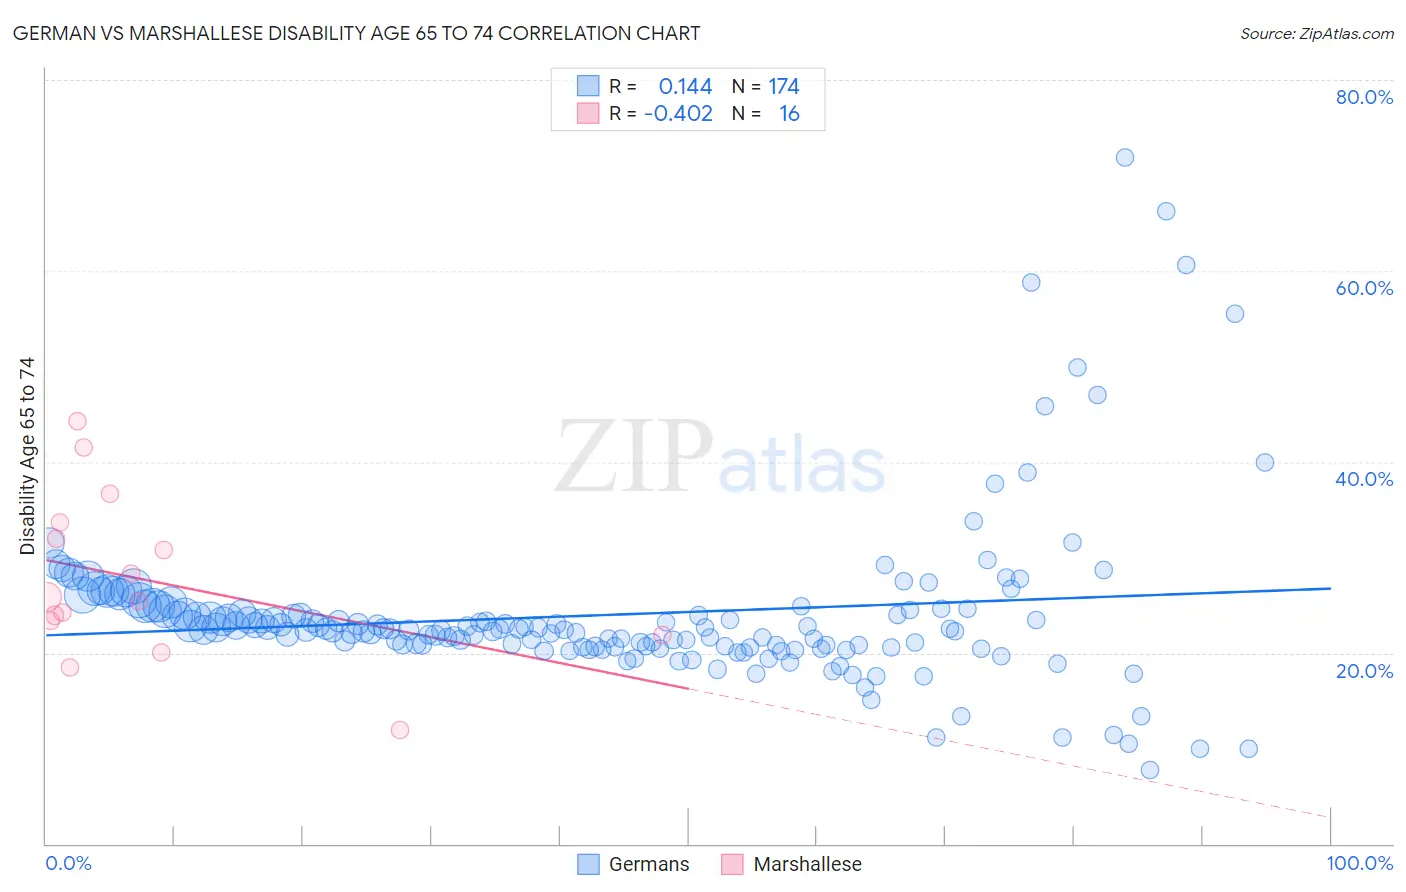
German vs Marshallese Disability Age 65 to 74 Correlation Chart
The statistical analysis conducted on geographies consisting of 577,988,449 people shows a poor positive correlation between the proportion of Germans and percentage of population with a disability between the ages 65 and 75 in the United States with a correlation coefficient (R) of 0.144 and weighted average of 23.3%. Similarly, the statistical analysis conducted on geographies consisting of 14,761,315 people shows a moderate negative correlation between the proportion of Marshallese and percentage of population with a disability between the ages 65 and 75 in the United States with a correlation coefficient (R) of -0.402 and weighted average of 25.3%, a difference of 8.4%.
Disability Age 65 to 74 Correlation Summary
| Measurement | German | Marshallese |
| Minimum | 7.7% | 11.9% |
| Maximum | 71.9% | 44.3% |
| Range | 64.2% | 32.4% |
| Mean | 24.0% | 27.6% |
| Median | 22.5% | 25.6% |
| Interquartile 25% (IQ1) | 20.7% | 22.6% |
| Interquartile 75% (IQ3) | 24.5% | 32.8% |
| Interquartile Range (IQR) | 3.8% | 10.2% |
| Standard Deviation (Sample) | 8.7% | 8.5% |
| Standard Deviation (Population) | 8.7% | 8.2% |
Similar Demographics by Disability Age 65 to 74
Demographics Similar to Germans by Disability Age 65 to 74
In terms of disability age 65 to 74, the demographic groups most similar to Germans are Yugoslavian (23.3%, a difference of 0.020%), Immigrants from South Eastern Asia (23.3%, a difference of 0.030%), Dutch (23.3%, a difference of 0.070%), Cuban (23.3%, a difference of 0.080%), and Immigrants from Eritrea (23.4%, a difference of 0.17%).
| Demographics | Rating | Rank | Disability Age 65 to 74 |
| Vietnamese | 60.8 /100 | #165 | Good 23.2% |
| Immigrants | Afghanistan | 60.5 /100 | #166 | Good 23.2% |
| Immigrants | Bosnia and Herzegovina | 57.6 /100 | #167 | Average 23.2% |
| Pakistanis | 57.0 /100 | #168 | Average 23.2% |
| Icelanders | 54.3 /100 | #169 | Average 23.3% |
| Moroccans | 54.2 /100 | #170 | Average 23.3% |
| Cubans | 51.9 /100 | #171 | Average 23.3% |
| Germans | 50.5 /100 | #172 | Average 23.3% |
| Yugoslavians | 50.2 /100 | #173 | Average 23.3% |
| Immigrants | South Eastern Asia | 50.0 /100 | #174 | Average 23.3% |
| Dutch | 49.4 /100 | #175 | Average 23.3% |
| Immigrants | Eritrea | 47.5 /100 | #176 | Average 23.4% |
| Immigrants | Haiti | 47.5 /100 | #177 | Average 23.4% |
| Guyanese | 45.8 /100 | #178 | Average 23.4% |
| Immigrants | Sierra Leone | 45.8 /100 | #179 | Average 23.4% |
Demographics Similar to Marshallese by Disability Age 65 to 74
In terms of disability age 65 to 74, the demographic groups most similar to Marshallese are Guamanian/Chamorro (25.3%, a difference of 0.060%), Immigrants from Cambodia (25.3%, a difference of 0.090%), Immigrants from Somalia (25.2%, a difference of 0.23%), Malaysian (25.4%, a difference of 0.41%), and Cape Verdean (25.4%, a difference of 0.49%).
| Demographics | Rating | Rank | Disability Age 65 to 74 |
| Immigrants | Nonimmigrants | 0.7 /100 | #251 | Tragic 25.0% |
| Immigrants | El Salvador | 0.6 /100 | #252 | Tragic 25.1% |
| Sub-Saharan Africans | 0.6 /100 | #253 | Tragic 25.1% |
| Somalis | 0.6 /100 | #254 | Tragic 25.1% |
| Central Americans | 0.5 /100 | #255 | Tragic 25.1% |
| Immigrants | Somalia | 0.4 /100 | #256 | Tragic 25.2% |
| Guamanians/Chamorros | 0.3 /100 | #257 | Tragic 25.3% |
| Marshallese | 0.3 /100 | #258 | Tragic 25.3% |
| Immigrants | Cambodia | 0.3 /100 | #259 | Tragic 25.3% |
| Malaysians | 0.2 /100 | #260 | Tragic 25.4% |
| Cape Verdeans | 0.2 /100 | #261 | Tragic 25.4% |
| Samoans | 0.2 /100 | #262 | Tragic 25.4% |
| Iroquois | 0.2 /100 | #263 | Tragic 25.4% |
| Hawaiians | 0.2 /100 | #264 | Tragic 25.5% |
| Guatemalans | 0.2 /100 | #265 | Tragic 25.5% |