German vs Immigrants from Dominica Disability Age 65 to 74
COMPARE
German
Immigrants from Dominica
Disability Age 65 to 74
Disability Age 65 to 74 Comparison
Germans
Immigrants from Dominica
23.3%
DISABILITY AGE 65 TO 74
50.5/ 100
METRIC RATING
172nd/ 347
METRIC RANK
25.7%
DISABILITY AGE 65 TO 74
0.1/ 100
METRIC RATING
272nd/ 347
METRIC RANK
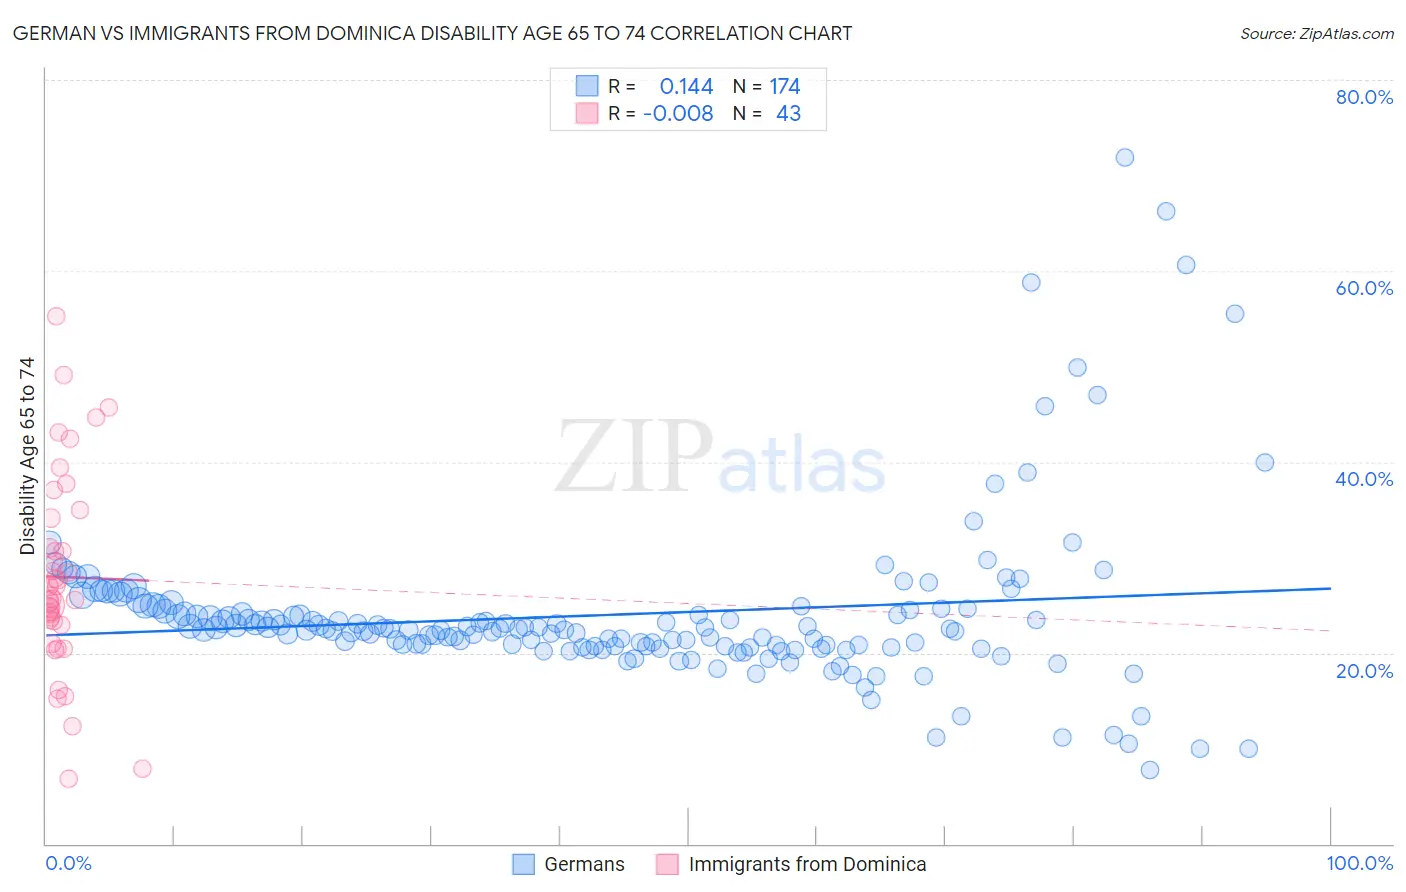
German vs Immigrants from Dominica Disability Age 65 to 74 Correlation Chart
The statistical analysis conducted on geographies consisting of 577,988,449 people shows a poor positive correlation between the proportion of Germans and percentage of population with a disability between the ages 65 and 75 in the United States with a correlation coefficient (R) of 0.144 and weighted average of 23.3%. Similarly, the statistical analysis conducted on geographies consisting of 83,763,598 people shows no correlation between the proportion of Immigrants from Dominica and percentage of population with a disability between the ages 65 and 75 in the United States with a correlation coefficient (R) of -0.008 and weighted average of 25.7%, a difference of 10.1%.
Disability Age 65 to 74 Correlation Summary
| Measurement | German | Immigrants from Dominica |
| Minimum | 7.7% | 6.9% |
| Maximum | 71.9% | 55.3% |
| Range | 64.2% | 48.4% |
| Mean | 24.0% | 27.9% |
| Median | 22.5% | 25.7% |
| Interquartile 25% (IQ1) | 20.7% | 22.9% |
| Interquartile 75% (IQ3) | 24.5% | 34.1% |
| Interquartile Range (IQR) | 3.8% | 11.3% |
| Standard Deviation (Sample) | 8.7% | 10.4% |
| Standard Deviation (Population) | 8.7% | 10.3% |
Similar Demographics by Disability Age 65 to 74
Demographics Similar to Germans by Disability Age 65 to 74
In terms of disability age 65 to 74, the demographic groups most similar to Germans are Yugoslavian (23.3%, a difference of 0.020%), Immigrants from South Eastern Asia (23.3%, a difference of 0.030%), Dutch (23.3%, a difference of 0.070%), Cuban (23.3%, a difference of 0.080%), and Immigrants from Eritrea (23.4%, a difference of 0.17%).
| Demographics | Rating | Rank | Disability Age 65 to 74 |
| Vietnamese | 60.8 /100 | #165 | Good 23.2% |
| Immigrants | Afghanistan | 60.5 /100 | #166 | Good 23.2% |
| Immigrants | Bosnia and Herzegovina | 57.6 /100 | #167 | Average 23.2% |
| Pakistanis | 57.0 /100 | #168 | Average 23.2% |
| Icelanders | 54.3 /100 | #169 | Average 23.3% |
| Moroccans | 54.2 /100 | #170 | Average 23.3% |
| Cubans | 51.9 /100 | #171 | Average 23.3% |
| Germans | 50.5 /100 | #172 | Average 23.3% |
| Yugoslavians | 50.2 /100 | #173 | Average 23.3% |
| Immigrants | South Eastern Asia | 50.0 /100 | #174 | Average 23.3% |
| Dutch | 49.4 /100 | #175 | Average 23.3% |
| Immigrants | Eritrea | 47.5 /100 | #176 | Average 23.4% |
| Immigrants | Haiti | 47.5 /100 | #177 | Average 23.4% |
| Guyanese | 45.8 /100 | #178 | Average 23.4% |
| Immigrants | Sierra Leone | 45.8 /100 | #179 | Average 23.4% |
Demographics Similar to Immigrants from Dominica by Disability Age 65 to 74
In terms of disability age 65 to 74, the demographic groups most similar to Immigrants from Dominica are Immigrants from Liberia (25.7%, a difference of 0.0%), Immigrants from Guatemala (25.7%, a difference of 0.030%), Hmong (25.7%, a difference of 0.11%), Japanese (25.7%, a difference of 0.13%), and Liberian (25.6%, a difference of 0.23%).
| Demographics | Rating | Rank | Disability Age 65 to 74 |
| Guatemalans | 0.2 /100 | #265 | Tragic 25.5% |
| Immigrants | Latin America | 0.1 /100 | #266 | Tragic 25.6% |
| Ottawa | 0.1 /100 | #267 | Tragic 25.6% |
| Liberians | 0.1 /100 | #268 | Tragic 25.6% |
| Hmong | 0.1 /100 | #269 | Tragic 25.7% |
| Immigrants | Guatemala | 0.1 /100 | #270 | Tragic 25.7% |
| Immigrants | Liberia | 0.1 /100 | #271 | Tragic 25.7% |
| Immigrants | Dominica | 0.1 /100 | #272 | Tragic 25.7% |
| Japanese | 0.1 /100 | #273 | Tragic 25.7% |
| Americans | 0.1 /100 | #274 | Tragic 25.8% |
| Hondurans | 0.1 /100 | #275 | Tragic 25.8% |
| French American Indians | 0.1 /100 | #276 | Tragic 25.8% |
| Belizeans | 0.1 /100 | #277 | Tragic 25.8% |
| Immigrants | Belize | 0.1 /100 | #278 | Tragic 25.8% |
| U.S. Virgin Islanders | 0.1 /100 | #279 | Tragic 25.9% |