German vs Immigrants from Sierra Leone Disability Age 65 to 74
COMPARE
German
Immigrants from Sierra Leone
Disability Age 65 to 74
Disability Age 65 to 74 Comparison
Germans
Immigrants from Sierra Leone
23.3%
DISABILITY AGE 65 TO 74
50.5/ 100
METRIC RATING
172nd/ 347
METRIC RANK
23.4%
DISABILITY AGE 65 TO 74
45.8/ 100
METRIC RATING
179th/ 347
METRIC RANK
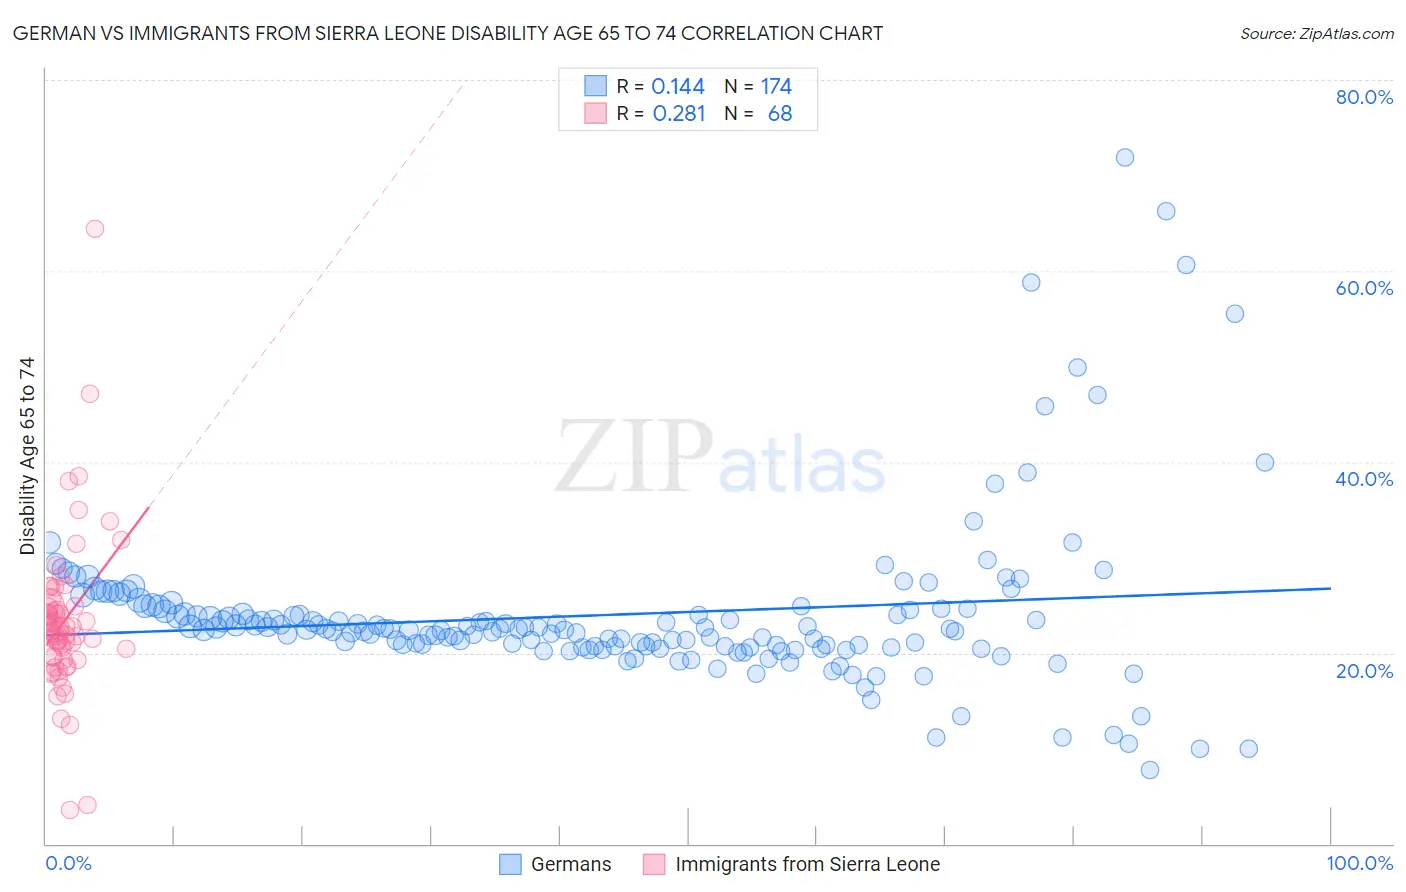
German vs Immigrants from Sierra Leone Disability Age 65 to 74 Correlation Chart
The statistical analysis conducted on geographies consisting of 577,988,449 people shows a poor positive correlation between the proportion of Germans and percentage of population with a disability between the ages 65 and 75 in the United States with a correlation coefficient (R) of 0.144 and weighted average of 23.3%. Similarly, the statistical analysis conducted on geographies consisting of 101,582,916 people shows a weak positive correlation between the proportion of Immigrants from Sierra Leone and percentage of population with a disability between the ages 65 and 75 in the United States with a correlation coefficient (R) of 0.281 and weighted average of 23.4%, a difference of 0.28%.
Disability Age 65 to 74 Correlation Summary
| Measurement | German | Immigrants from Sierra Leone |
| Minimum | 7.7% | 3.5% |
| Maximum | 71.9% | 64.4% |
| Range | 64.2% | 60.9% |
| Mean | 24.0% | 23.4% |
| Median | 22.5% | 22.2% |
| Interquartile 25% (IQ1) | 20.7% | 19.5% |
| Interquartile 75% (IQ3) | 24.5% | 24.8% |
| Interquartile Range (IQR) | 3.8% | 5.2% |
| Standard Deviation (Sample) | 8.7% | 8.4% |
| Standard Deviation (Population) | 8.7% | 8.3% |
Demographics Similar to Germans and Immigrants from Sierra Leone by Disability Age 65 to 74
In terms of disability age 65 to 74, the demographic groups most similar to Germans are Yugoslavian (23.3%, a difference of 0.020%), Immigrants from South Eastern Asia (23.3%, a difference of 0.030%), Dutch (23.3%, a difference of 0.070%), Cuban (23.3%, a difference of 0.080%), and Immigrants from Eritrea (23.4%, a difference of 0.17%). Similarly, the demographic groups most similar to Immigrants from Sierra Leone are Guyanese (23.4%, a difference of 0.0%), Scandinavian (23.4%, a difference of 0.010%), Assyrian/Chaldean/Syriac (23.4%, a difference of 0.030%), Irish (23.4%, a difference of 0.080%), and Immigrants from Eritrea (23.4%, a difference of 0.10%).
| Demographics | Rating | Rank | Disability Age 65 to 74 |
| Vietnamese | 60.8 /100 | #165 | Good 23.2% |
| Immigrants | Afghanistan | 60.5 /100 | #166 | Good 23.2% |
| Immigrants | Bosnia and Herzegovina | 57.6 /100 | #167 | Average 23.2% |
| Pakistanis | 57.0 /100 | #168 | Average 23.2% |
| Icelanders | 54.3 /100 | #169 | Average 23.3% |
| Moroccans | 54.2 /100 | #170 | Average 23.3% |
| Cubans | 51.9 /100 | #171 | Average 23.3% |
| Germans | 50.5 /100 | #172 | Average 23.3% |
| Yugoslavians | 50.2 /100 | #173 | Average 23.3% |
| Immigrants | South Eastern Asia | 50.0 /100 | #174 | Average 23.3% |
| Dutch | 49.4 /100 | #175 | Average 23.3% |
| Immigrants | Eritrea | 47.5 /100 | #176 | Average 23.4% |
| Immigrants | Haiti | 47.5 /100 | #177 | Average 23.4% |
| Guyanese | 45.8 /100 | #178 | Average 23.4% |
| Immigrants | Sierra Leone | 45.8 /100 | #179 | Average 23.4% |
| Scandinavians | 45.6 /100 | #180 | Average 23.4% |
| Assyrians/Chaldeans/Syriacs | 45.3 /100 | #181 | Average 23.4% |
| Irish | 44.4 /100 | #182 | Average 23.4% |
| Immigrants | Eastern Africa | 42.8 /100 | #183 | Average 23.4% |
| Immigrants | Germany | 42.5 /100 | #184 | Average 23.4% |
| Haitians | 42.4 /100 | #185 | Average 23.4% |