German Russian vs Ghanaian Male Disability
COMPARE
German Russian
Ghanaian
Male Disability
Male Disability Comparison
German Russians
Ghanaians
12.0%
MALE DISABILITY
0.5/ 100
METRIC RATING
251st/ 347
METRIC RANK
10.8%
MALE DISABILITY
93.4/ 100
METRIC RATING
112th/ 347
METRIC RANK
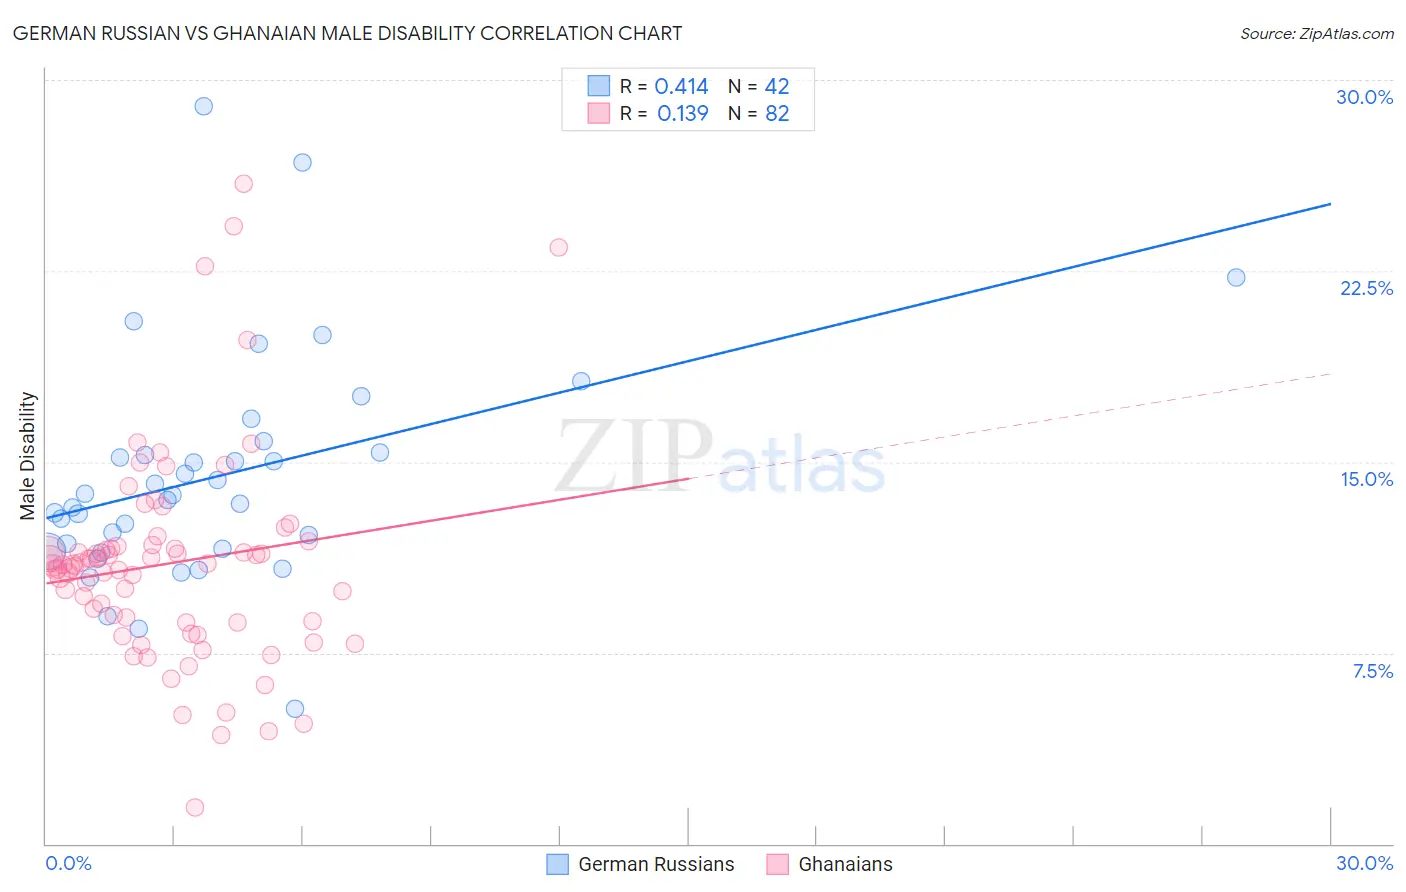
German Russian vs Ghanaian Male Disability Correlation Chart
The statistical analysis conducted on geographies consisting of 96,458,633 people shows a moderate positive correlation between the proportion of German Russians and percentage of males with a disability in the United States with a correlation coefficient (R) of 0.414 and weighted average of 12.0%. Similarly, the statistical analysis conducted on geographies consisting of 190,687,278 people shows a poor positive correlation between the proportion of Ghanaians and percentage of males with a disability in the United States with a correlation coefficient (R) of 0.139 and weighted average of 10.8%, a difference of 11.3%.
Male Disability Correlation Summary
| Measurement | German Russian | Ghanaian |
| Minimum | 5.3% | 1.4% |
| Maximum | 29.0% | 25.9% |
| Range | 23.7% | 24.5% |
| Mean | 14.4% | 11.0% |
| Median | 13.6% | 11.0% |
| Interquartile 25% (IQ1) | 11.6% | 8.7% |
| Interquartile 75% (IQ3) | 15.4% | 11.7% |
| Interquartile Range (IQR) | 3.8% | 3.0% |
| Standard Deviation (Sample) | 4.5% | 4.2% |
| Standard Deviation (Population) | 4.4% | 4.1% |
Similar Demographics by Male Disability
Demographics Similar to German Russians by Male Disability
In terms of male disability, the demographic groups most similar to German Russians are Bangladeshi (12.0%, a difference of 0.010%), Immigrants from Yemen (12.0%, a difference of 0.060%), Slovene (12.0%, a difference of 0.070%), Guamanian/Chamorro (12.0%, a difference of 0.070%), and British (12.1%, a difference of 0.26%).
| Demographics | Rating | Rank | Male Disability |
| Immigrants | Laos | 1.0 /100 | #244 | Tragic 11.9% |
| Immigrants | Liberia | 1.0 /100 | #245 | Tragic 11.9% |
| Danes | 0.9 /100 | #246 | Tragic 11.9% |
| Hungarians | 0.8 /100 | #247 | Tragic 12.0% |
| Poles | 0.7 /100 | #248 | Tragic 12.0% |
| Immigrants | Yemen | 0.5 /100 | #249 | Tragic 12.0% |
| Bangladeshis | 0.5 /100 | #250 | Tragic 12.0% |
| German Russians | 0.5 /100 | #251 | Tragic 12.0% |
| Slovenes | 0.5 /100 | #252 | Tragic 12.0% |
| Guamanians/Chamorros | 0.5 /100 | #253 | Tragic 12.0% |
| British | 0.4 /100 | #254 | Tragic 12.1% |
| Chinese | 0.4 /100 | #255 | Tragic 12.1% |
| Swiss | 0.3 /100 | #256 | Tragic 12.1% |
| Europeans | 0.3 /100 | #257 | Tragic 12.1% |
| Basques | 0.3 /100 | #258 | Tragic 12.1% |
Demographics Similar to Ghanaians by Male Disability
In terms of male disability, the demographic groups most similar to Ghanaians are Immigrants from Zimbabwe (10.8%, a difference of 0.090%), Immigrants from Uruguay (10.8%, a difference of 0.10%), Immigrants (10.8%, a difference of 0.14%), Central American (10.8%, a difference of 0.15%), and Immigrants from Uganda (10.8%, a difference of 0.16%).
| Demographics | Rating | Rank | Male Disability |
| Immigrants | Brazil | 95.0 /100 | #105 | Exceptional 10.8% |
| Immigrants | Syria | 94.9 /100 | #106 | Exceptional 10.8% |
| Immigrants | Eastern Africa | 94.3 /100 | #107 | Exceptional 10.8% |
| Immigrants | Belgium | 94.2 /100 | #108 | Exceptional 10.8% |
| Immigrants | Uganda | 94.0 /100 | #109 | Exceptional 10.8% |
| Immigrants | Immigrants | 93.9 /100 | #110 | Exceptional 10.8% |
| Immigrants | Uruguay | 93.8 /100 | #111 | Exceptional 10.8% |
| Ghanaians | 93.4 /100 | #112 | Exceptional 10.8% |
| Immigrants | Zimbabwe | 93.0 /100 | #113 | Exceptional 10.8% |
| Central Americans | 92.7 /100 | #114 | Exceptional 10.8% |
| Immigrants | Barbados | 92.2 /100 | #115 | Exceptional 10.8% |
| Immigrants | South Africa | 91.8 /100 | #116 | Exceptional 10.8% |
| Eastern Europeans | 90.6 /100 | #117 | Exceptional 10.9% |
| Immigrants | Cuba | 90.2 /100 | #118 | Exceptional 10.9% |
| Armenians | 90.1 /100 | #119 | Exceptional 10.9% |