Immigrants from St. Vincent and the Grenadines vs Ghanaian Male Disability
COMPARE
Immigrants from St. Vincent and the Grenadines
Ghanaian
Male Disability
Male Disability Comparison
Immigrants from St. Vincent and the Grenadines
Ghanaians
10.7%
MALE DISABILITY
97.1/ 100
METRIC RATING
93rd/ 347
METRIC RANK
10.8%
MALE DISABILITY
93.4/ 100
METRIC RATING
112th/ 347
METRIC RANK
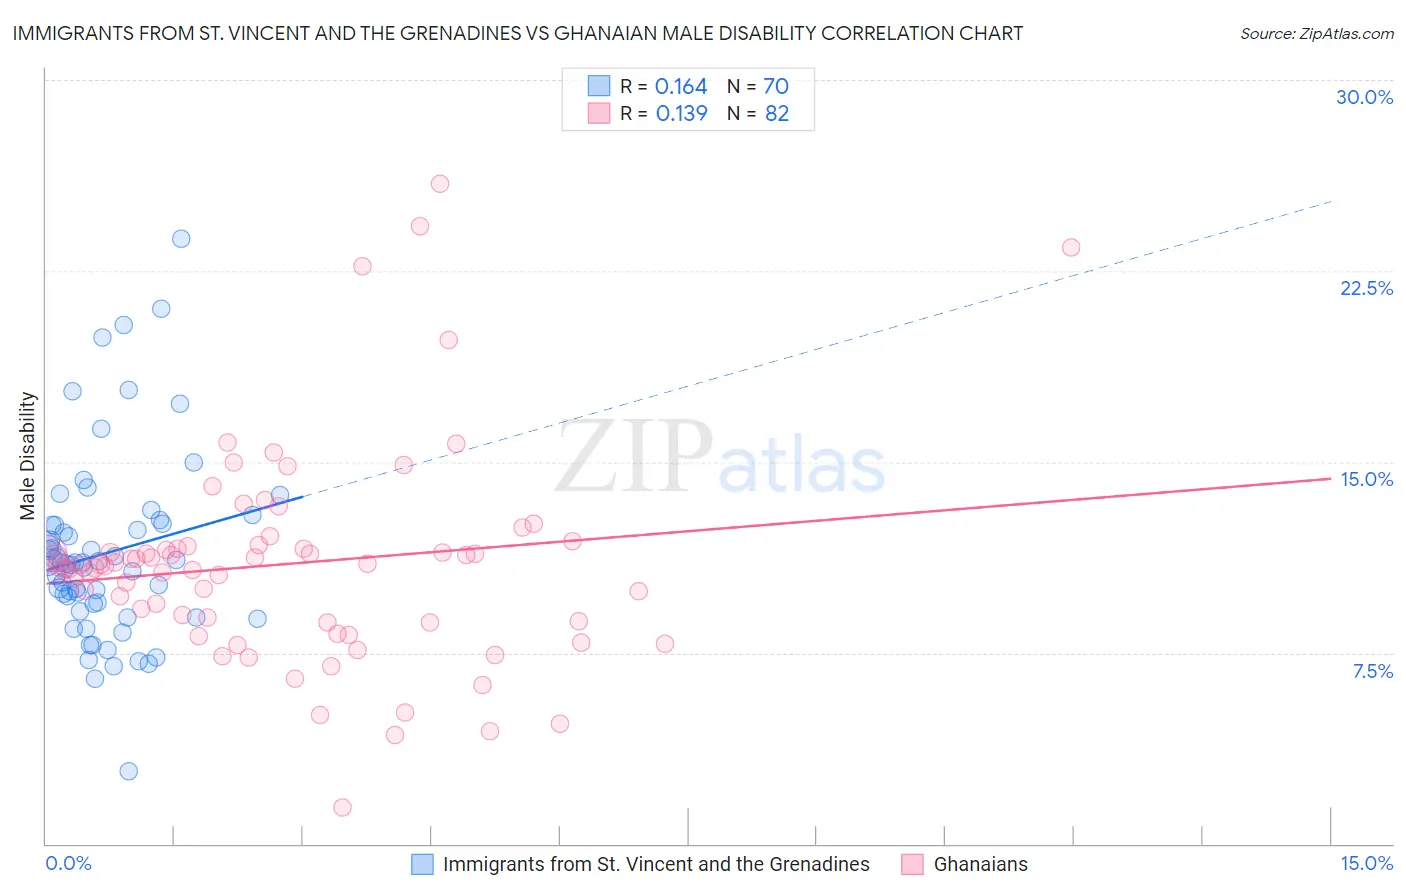
Immigrants from St. Vincent and the Grenadines vs Ghanaian Male Disability Correlation Chart
The statistical analysis conducted on geographies consisting of 56,189,334 people shows a poor positive correlation between the proportion of Immigrants from St. Vincent and the Grenadines and percentage of males with a disability in the United States with a correlation coefficient (R) of 0.164 and weighted average of 10.7%. Similarly, the statistical analysis conducted on geographies consisting of 190,687,278 people shows a poor positive correlation between the proportion of Ghanaians and percentage of males with a disability in the United States with a correlation coefficient (R) of 0.139 and weighted average of 10.8%, a difference of 1.3%.
Male Disability Correlation Summary
| Measurement | Immigrants from St. Vincent and the Grenadines | Ghanaian |
| Minimum | 2.8% | 1.4% |
| Maximum | 23.8% | 25.9% |
| Range | 20.9% | 24.5% |
| Mean | 11.4% | 11.0% |
| Median | 11.0% | 11.0% |
| Interquartile 25% (IQ1) | 9.4% | 8.7% |
| Interquartile 75% (IQ3) | 12.5% | 11.7% |
| Interquartile Range (IQR) | 3.1% | 3.0% |
| Standard Deviation (Sample) | 3.6% | 4.2% |
| Standard Deviation (Population) | 3.6% | 4.1% |
Demographics Similar to Immigrants from St. Vincent and the Grenadines and Ghanaians by Male Disability
In terms of male disability, the demographic groups most similar to Immigrants from St. Vincent and the Grenadines are Immigrants from Sweden (10.7%, a difference of 0.11%), Palestinian (10.7%, a difference of 0.13%), Chilean (10.7%, a difference of 0.14%), Nicaraguan (10.7%, a difference of 0.24%), and Immigrants from Armenia (10.7%, a difference of 0.26%). Similarly, the demographic groups most similar to Ghanaians are Immigrants from Uruguay (10.8%, a difference of 0.10%), Immigrants (10.8%, a difference of 0.14%), Immigrants from Uganda (10.8%, a difference of 0.16%), Immigrants from Belgium (10.8%, a difference of 0.21%), and Immigrants from Eastern Africa (10.8%, a difference of 0.23%).
| Demographics | Rating | Rank | Male Disability |
| Palestinians | 97.4 /100 | #92 | Exceptional 10.7% |
| Immigrants | St. Vincent and the Grenadines | 97.1 /100 | #93 | Exceptional 10.7% |
| Immigrants | Sweden | 96.9 /100 | #94 | Exceptional 10.7% |
| Chileans | 96.9 /100 | #95 | Exceptional 10.7% |
| Nicaraguans | 96.6 /100 | #96 | Exceptional 10.7% |
| Immigrants | Armenia | 96.6 /100 | #97 | Exceptional 10.7% |
| Immigrants | Romania | 96.5 /100 | #98 | Exceptional 10.7% |
| Immigrants | Switzerland | 96.1 /100 | #99 | Exceptional 10.7% |
| Immigrants | Kazakhstan | 95.9 /100 | #100 | Exceptional 10.7% |
| Immigrants | Greece | 95.6 /100 | #101 | Exceptional 10.7% |
| Immigrants | Eastern Europe | 95.3 /100 | #102 | Exceptional 10.7% |
| Uruguayans | 95.3 /100 | #103 | Exceptional 10.7% |
| Immigrants | Nigeria | 95.1 /100 | #104 | Exceptional 10.8% |
| Immigrants | Brazil | 95.0 /100 | #105 | Exceptional 10.8% |
| Immigrants | Syria | 94.9 /100 | #106 | Exceptional 10.8% |
| Immigrants | Eastern Africa | 94.3 /100 | #107 | Exceptional 10.8% |
| Immigrants | Belgium | 94.2 /100 | #108 | Exceptional 10.8% |
| Immigrants | Uganda | 94.0 /100 | #109 | Exceptional 10.8% |
| Immigrants | Immigrants | 93.9 /100 | #110 | Exceptional 10.8% |
| Immigrants | Uruguay | 93.8 /100 | #111 | Exceptional 10.8% |
| Ghanaians | 93.4 /100 | #112 | Exceptional 10.8% |