French American Indian vs Immigrants from Turkey Family Households with Children
COMPARE
French American Indian
Immigrants from Turkey
Family Households with Children
Family Households with Children Comparison
French American Indians
Immigrants from Turkey
26.6%
FAMILY HOUSEHOLDS WITH CHILDREN
0.3/ 100
METRIC RATING
282nd/ 347
METRIC RANK
27.4%
FAMILY HOUSEHOLDS WITH CHILDREN
46.9/ 100
METRIC RATING
180th/ 347
METRIC RANK
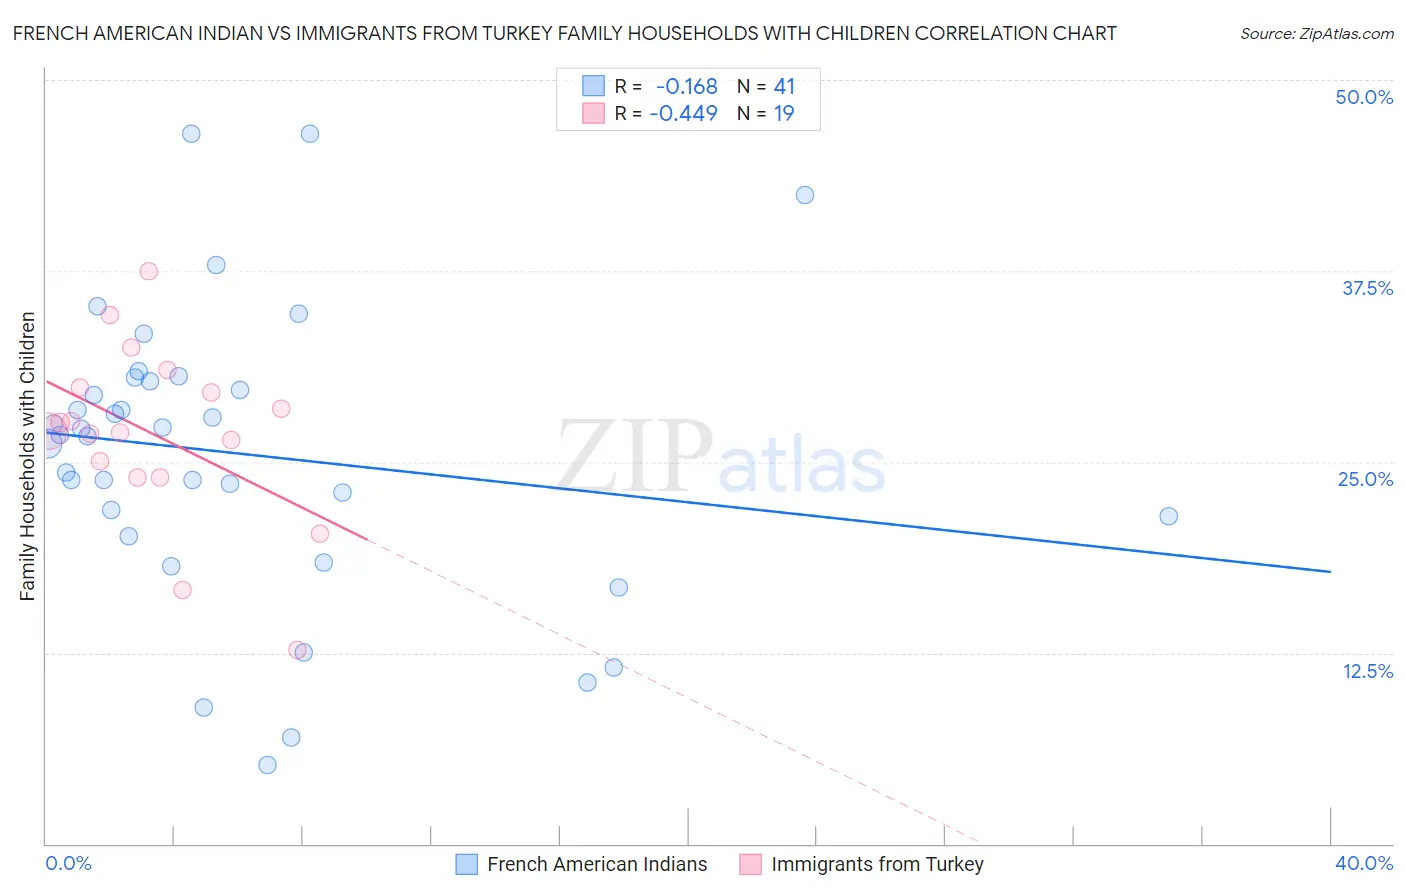
French American Indian vs Immigrants from Turkey Family Households with Children Correlation Chart
The statistical analysis conducted on geographies consisting of 131,954,701 people shows a poor negative correlation between the proportion of French American Indians and percentage of family households with children in the United States with a correlation coefficient (R) of -0.168 and weighted average of 26.6%. Similarly, the statistical analysis conducted on geographies consisting of 222,939,081 people shows a moderate negative correlation between the proportion of Immigrants from Turkey and percentage of family households with children in the United States with a correlation coefficient (R) of -0.449 and weighted average of 27.4%, a difference of 3.2%.
Family Households with Children Correlation Summary
| Measurement | French American Indian | Immigrants from Turkey |
| Minimum | 5.1% | 12.6% |
| Maximum | 46.5% | 37.5% |
| Range | 41.4% | 24.8% |
| Mean | 25.5% | 26.8% |
| Median | 26.7% | 27.0% |
| Interquartile 25% (IQ1) | 20.8% | 24.0% |
| Interquartile 75% (IQ3) | 30.4% | 29.9% |
| Interquartile Range (IQR) | 9.6% | 5.9% |
| Standard Deviation (Sample) | 9.5% | 5.8% |
| Standard Deviation (Population) | 9.4% | 5.7% |
Similar Demographics by Family Households with Children
Demographics Similar to French American Indians by Family Households with Children
In terms of family households with children, the demographic groups most similar to French American Indians are Lithuanian (26.6%, a difference of 0.010%), Immigrants from North America (26.6%, a difference of 0.070%), Immigrants from Canada (26.5%, a difference of 0.090%), Senegalese (26.6%, a difference of 0.11%), and Cambodian (26.5%, a difference of 0.12%).
| Demographics | Rating | Rank | Family Households with Children |
| Immigrants | Northern Europe | 0.5 /100 | #275 | Tragic 26.7% |
| Immigrants | Spain | 0.5 /100 | #276 | Tragic 26.6% |
| Celtics | 0.4 /100 | #277 | Tragic 26.6% |
| Immigrants | Europe | 0.4 /100 | #278 | Tragic 26.6% |
| Finns | 0.4 /100 | #279 | Tragic 26.6% |
| Senegalese | 0.4 /100 | #280 | Tragic 26.6% |
| Lithuanians | 0.3 /100 | #281 | Tragic 26.6% |
| French American Indians | 0.3 /100 | #282 | Tragic 26.6% |
| Immigrants | North America | 0.3 /100 | #283 | Tragic 26.6% |
| Immigrants | Canada | 0.3 /100 | #284 | Tragic 26.5% |
| Cambodians | 0.2 /100 | #285 | Tragic 26.5% |
| Immigrants | Senegal | 0.2 /100 | #286 | Tragic 26.5% |
| Shoshone | 0.2 /100 | #287 | Tragic 26.5% |
| Russians | 0.2 /100 | #288 | Tragic 26.5% |
| Immigrants | Sweden | 0.2 /100 | #289 | Tragic 26.5% |
Demographics Similar to Immigrants from Turkey by Family Households with Children
In terms of family households with children, the demographic groups most similar to Immigrants from Turkey are Turkish (27.4%, a difference of 0.0%), Aleut (27.4%, a difference of 0.0%), Puget Sound Salish (27.4%, a difference of 0.010%), Spanish American (27.4%, a difference of 0.040%), and Ugandan (27.4%, a difference of 0.050%).
| Demographics | Rating | Rank | Family Households with Children |
| Immigrants | Argentina | 52.2 /100 | #173 | Average 27.5% |
| Whites/Caucasians | 50.0 /100 | #174 | Average 27.4% |
| British | 49.9 /100 | #175 | Average 27.4% |
| Immigrants | China | 49.6 /100 | #176 | Average 27.4% |
| Ugandans | 49.2 /100 | #177 | Average 27.4% |
| Spanish Americans | 48.9 /100 | #178 | Average 27.4% |
| Turks | 46.9 /100 | #179 | Average 27.4% |
| Immigrants | Turkey | 46.9 /100 | #180 | Average 27.4% |
| Aleuts | 46.7 /100 | #181 | Average 27.4% |
| Puget Sound Salish | 46.2 /100 | #182 | Average 27.4% |
| South Africans | 44.9 /100 | #183 | Average 27.4% |
| Native Hawaiians | 44.6 /100 | #184 | Average 27.4% |
| Delaware | 42.0 /100 | #185 | Average 27.4% |
| Immigrants | Brazil | 40.6 /100 | #186 | Average 27.4% |
| Creek | 39.8 /100 | #187 | Fair 27.4% |