Finnish vs Immigrants from North America Single Mother Households
COMPARE
Finnish
Immigrants from North America
Single Mother Households
Single Mother Households Comparison
Finns
Immigrants from North America
5.7%
SINGLE MOTHER HOUSEHOLDS
97.6/ 100
METRIC RATING
86th/ 347
METRIC RANK
5.6%
SINGLE MOTHER HOUSEHOLDS
98.3/ 100
METRIC RATING
74th/ 347
METRIC RANK
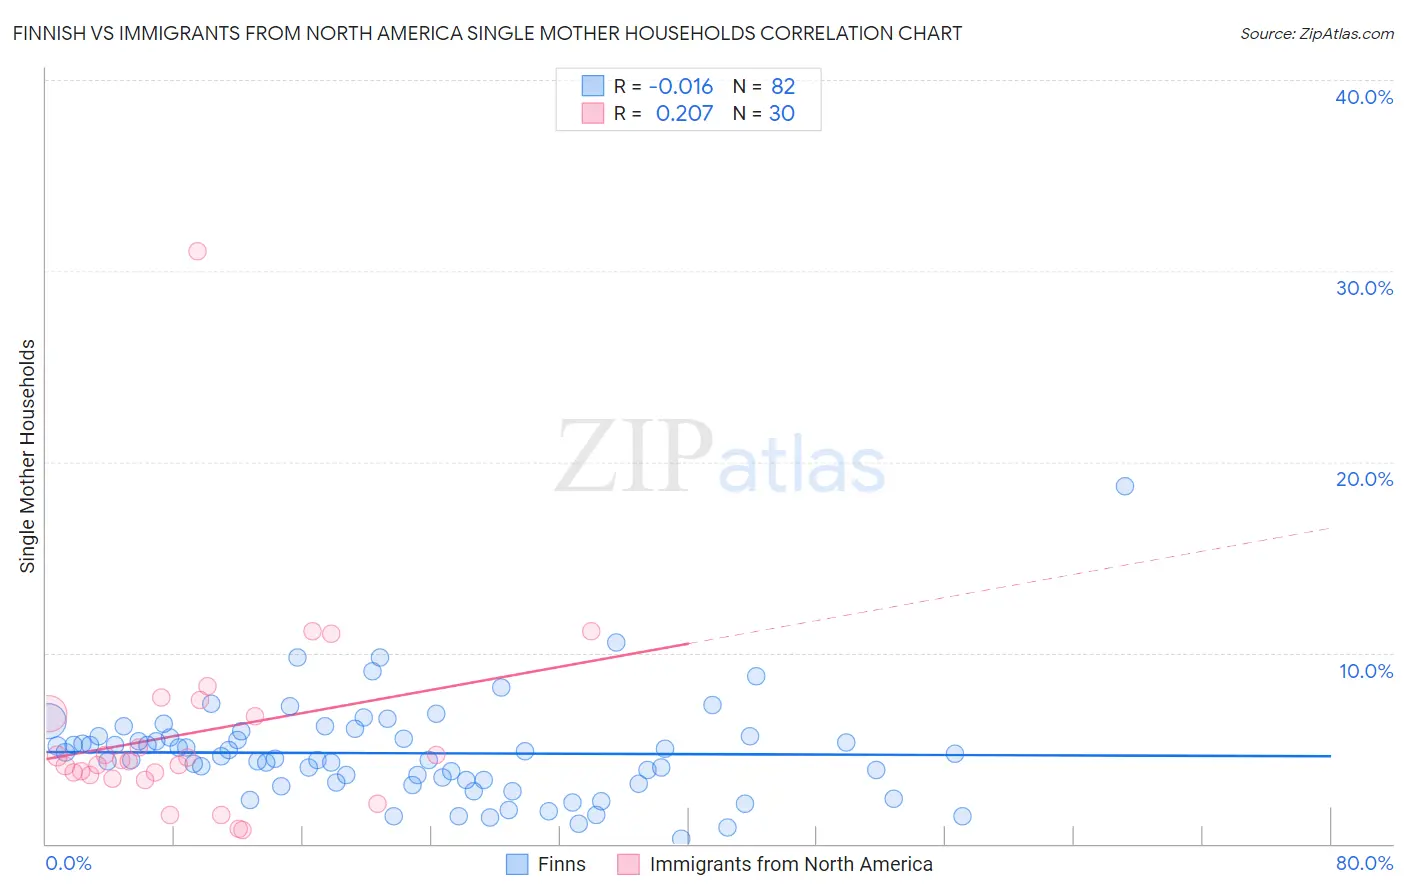
Finnish vs Immigrants from North America Single Mother Households Correlation Chart
The statistical analysis conducted on geographies consisting of 403,107,301 people shows no correlation between the proportion of Finns and percentage of single mother households in the United States with a correlation coefficient (R) of -0.016 and weighted average of 5.7%. Similarly, the statistical analysis conducted on geographies consisting of 460,394,376 people shows a weak positive correlation between the proportion of Immigrants from North America and percentage of single mother households in the United States with a correlation coefficient (R) of 0.207 and weighted average of 5.6%, a difference of 1.2%.
Single Mother Households Correlation Summary
| Measurement | Finnish | Immigrants from North America |
| Minimum | 0.26% | 0.70% |
| Maximum | 18.8% | 31.0% |
| Range | 18.5% | 30.3% |
| Mean | 4.7% | 5.8% |
| Median | 4.5% | 4.4% |
| Interquartile 25% (IQ1) | 3.2% | 3.6% |
| Interquartile 75% (IQ3) | 5.6% | 6.8% |
| Interquartile Range (IQR) | 2.4% | 3.2% |
| Standard Deviation (Sample) | 2.6% | 5.5% |
| Standard Deviation (Population) | 2.6% | 5.4% |
Demographics Similar to Finns and Immigrants from North America by Single Mother Households
In terms of single mother households, the demographic groups most similar to Finns are Hungarian (5.7%, a difference of 0.030%), Immigrants from Turkey (5.7%, a difference of 0.080%), Israeli (5.7%, a difference of 0.15%), Carpatho Rusyn (5.7%, a difference of 0.18%), and Immigrants from Hungary (5.7%, a difference of 0.25%). Similarly, the demographic groups most similar to Immigrants from North America are Immigrants from Asia (5.6%, a difference of 0.030%), Immigrants from Netherlands (5.6%, a difference of 0.090%), Slovene (5.6%, a difference of 0.14%), Immigrants from Kazakhstan (5.6%, a difference of 0.18%), and Immigrants from Eastern Europe (5.6%, a difference of 0.19%).
| Demographics | Rating | Rank | Single Mother Households |
| Immigrants | Eastern Europe | 98.4 /100 | #70 | Exceptional 5.6% |
| Immigrants | Kazakhstan | 98.4 /100 | #71 | Exceptional 5.6% |
| Immigrants | Netherlands | 98.4 /100 | #72 | Exceptional 5.6% |
| Immigrants | Asia | 98.4 /100 | #73 | Exceptional 5.6% |
| Immigrants | North America | 98.3 /100 | #74 | Exceptional 5.6% |
| Slovenes | 98.3 /100 | #75 | Exceptional 5.6% |
| New Zealanders | 98.2 /100 | #76 | Exceptional 5.6% |
| Romanians | 98.1 /100 | #77 | Exceptional 5.6% |
| Swiss | 98.1 /100 | #78 | Exceptional 5.6% |
| Immigrants | Sri Lanka | 98.0 /100 | #79 | Exceptional 5.6% |
| Czechs | 97.9 /100 | #80 | Exceptional 5.6% |
| Immigrants | Moldova | 97.9 /100 | #81 | Exceptional 5.6% |
| Immigrants | Malaysia | 97.8 /100 | #82 | Exceptional 5.7% |
| Immigrants | Hungary | 97.8 /100 | #83 | Exceptional 5.7% |
| Carpatho Rusyns | 97.7 /100 | #84 | Exceptional 5.7% |
| Hungarians | 97.6 /100 | #85 | Exceptional 5.7% |
| Finns | 97.6 /100 | #86 | Exceptional 5.7% |
| Immigrants | Turkey | 97.5 /100 | #87 | Exceptional 5.7% |
| Israelis | 97.4 /100 | #88 | Exceptional 5.7% |
| Ukrainians | 97.2 /100 | #89 | Exceptional 5.7% |
| Immigrants | Indonesia | 97.2 /100 | #90 | Exceptional 5.7% |