Immigrants from Sudan vs Zimbabwean Disability Age 35 to 64
COMPARE
Immigrants from Sudan
Zimbabwean
Disability Age 35 to 64
Disability Age 35 to 64 Comparison
Immigrants from Sudan
Zimbabweans
11.7%
DISABILITY AGE 35 TO 64
11.4/ 100
METRIC RATING
214th/ 347
METRIC RANK
10.4%
DISABILITY AGE 35 TO 64
97.4/ 100
METRIC RATING
107th/ 347
METRIC RANK
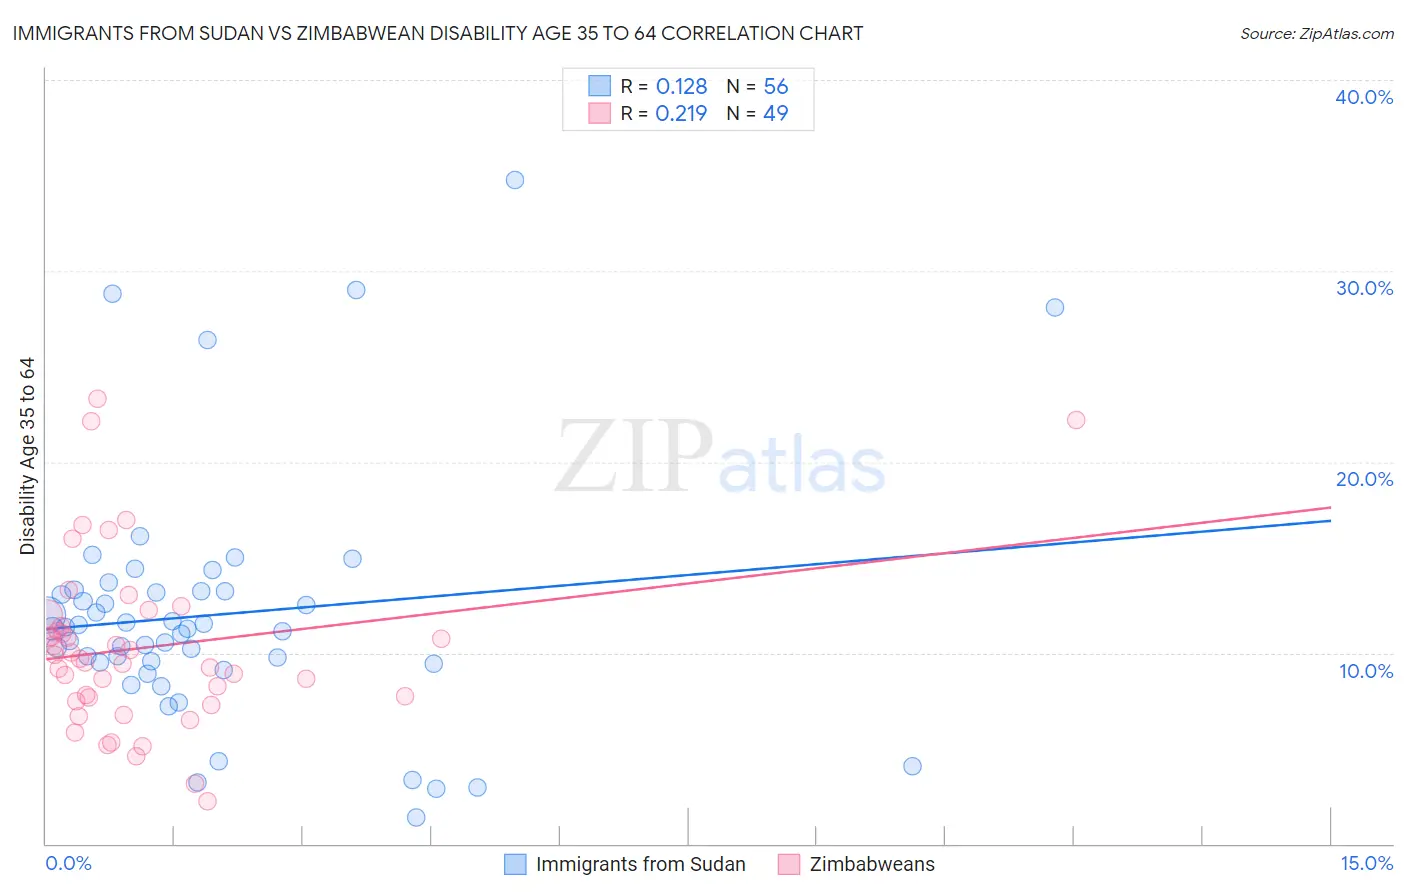
Immigrants from Sudan vs Zimbabwean Disability Age 35 to 64 Correlation Chart
The statistical analysis conducted on geographies consisting of 118,946,104 people shows a poor positive correlation between the proportion of Immigrants from Sudan and percentage of population with a disability between the ages 34 and 64 in the United States with a correlation coefficient (R) of 0.128 and weighted average of 11.7%. Similarly, the statistical analysis conducted on geographies consisting of 69,187,609 people shows a weak positive correlation between the proportion of Zimbabweans and percentage of population with a disability between the ages 34 and 64 in the United States with a correlation coefficient (R) of 0.219 and weighted average of 10.4%, a difference of 12.3%.
Disability Age 35 to 64 Correlation Summary
| Measurement | Immigrants from Sudan | Zimbabwean |
| Minimum | 1.4% | 2.2% |
| Maximum | 34.7% | 23.3% |
| Range | 33.4% | 21.1% |
| Mean | 12.0% | 10.3% |
| Median | 11.3% | 9.7% |
| Interquartile 25% (IQ1) | 9.5% | 7.5% |
| Interquartile 75% (IQ3) | 13.2% | 11.7% |
| Interquartile Range (IQR) | 3.7% | 4.2% |
| Standard Deviation (Sample) | 6.5% | 4.5% |
| Standard Deviation (Population) | 6.4% | 4.5% |
Similar Demographics by Disability Age 35 to 64
Demographics Similar to Immigrants from Sudan by Disability Age 35 to 64
In terms of disability age 35 to 64, the demographic groups most similar to Immigrants from Sudan are Yugoslavian (11.7%, a difference of 0.030%), Spanish American Indian (11.7%, a difference of 0.050%), Immigrants from Jamaica (11.7%, a difference of 0.060%), Bahamian (11.8%, a difference of 0.14%), and Canadian (11.7%, a difference of 0.28%).
| Demographics | Rating | Rank | Disability Age 35 to 64 |
| Ghanaians | 14.8 /100 | #207 | Poor 11.7% |
| Guatemalans | 14.6 /100 | #208 | Poor 11.7% |
| Europeans | 13.5 /100 | #209 | Poor 11.7% |
| Belgians | 13.1 /100 | #210 | Poor 11.7% |
| Canadians | 13.0 /100 | #211 | Poor 11.7% |
| Immigrants | Jamaica | 11.8 /100 | #212 | Poor 11.7% |
| Yugoslavians | 11.6 /100 | #213 | Poor 11.7% |
| Immigrants | Sudan | 11.4 /100 | #214 | Poor 11.7% |
| Spanish American Indians | 11.1 /100 | #215 | Poor 11.7% |
| Bahamians | 10.7 /100 | #216 | Poor 11.8% |
| Barbadians | 9.5 /100 | #217 | Tragic 11.8% |
| Immigrants | Bahamas | 9.2 /100 | #218 | Tragic 11.8% |
| Czechoslovakians | 9.0 /100 | #219 | Tragic 11.8% |
| Immigrants | West Indies | 8.9 /100 | #220 | Tragic 11.8% |
| Alsatians | 8.5 /100 | #221 | Tragic 11.8% |
Demographics Similar to Zimbabweans by Disability Age 35 to 64
In terms of disability age 35 to 64, the demographic groups most similar to Zimbabweans are Ethiopian (10.5%, a difference of 0.020%), Immigrants from Ethiopia (10.5%, a difference of 0.15%), Immigrants from Hungary (10.4%, a difference of 0.19%), Korean (10.5%, a difference of 0.22%), and Macedonian (10.4%, a difference of 0.34%).
| Demographics | Rating | Rank | Disability Age 35 to 64 |
| Immigrants | Jordan | 98.1 /100 | #100 | Exceptional 10.4% |
| Immigrants | Philippines | 98.0 /100 | #101 | Exceptional 10.4% |
| Immigrants | Western Asia | 98.0 /100 | #102 | Exceptional 10.4% |
| Immigrants | Ukraine | 97.9 /100 | #103 | Exceptional 10.4% |
| Immigrants | Austria | 97.8 /100 | #104 | Exceptional 10.4% |
| Macedonians | 97.8 /100 | #105 | Exceptional 10.4% |
| Immigrants | Hungary | 97.6 /100 | #106 | Exceptional 10.4% |
| Zimbabweans | 97.4 /100 | #107 | Exceptional 10.4% |
| Ethiopians | 97.4 /100 | #108 | Exceptional 10.5% |
| Immigrants | Ethiopia | 97.2 /100 | #109 | Exceptional 10.5% |
| Koreans | 97.1 /100 | #110 | Exceptional 10.5% |
| Brazilians | 96.9 /100 | #111 | Exceptional 10.5% |
| Assyrians/Chaldeans/Syriacs | 96.8 /100 | #112 | Exceptional 10.5% |
| Tongans | 96.6 /100 | #113 | Exceptional 10.5% |
| Immigrants | Morocco | 96.6 /100 | #114 | Exceptional 10.5% |