Filipino vs Irish Cognitive Disability
COMPARE
Filipino
Irish
Cognitive Disability
Cognitive Disability Comparison
Filipinos
Irish
16.4%
COGNITIVE DISABILITY
99.9/ 100
METRIC RATING
29th/ 347
METRIC RANK
16.8%
COGNITIVE DISABILITY
98.1/ 100
METRIC RATING
102nd/ 347
METRIC RANK
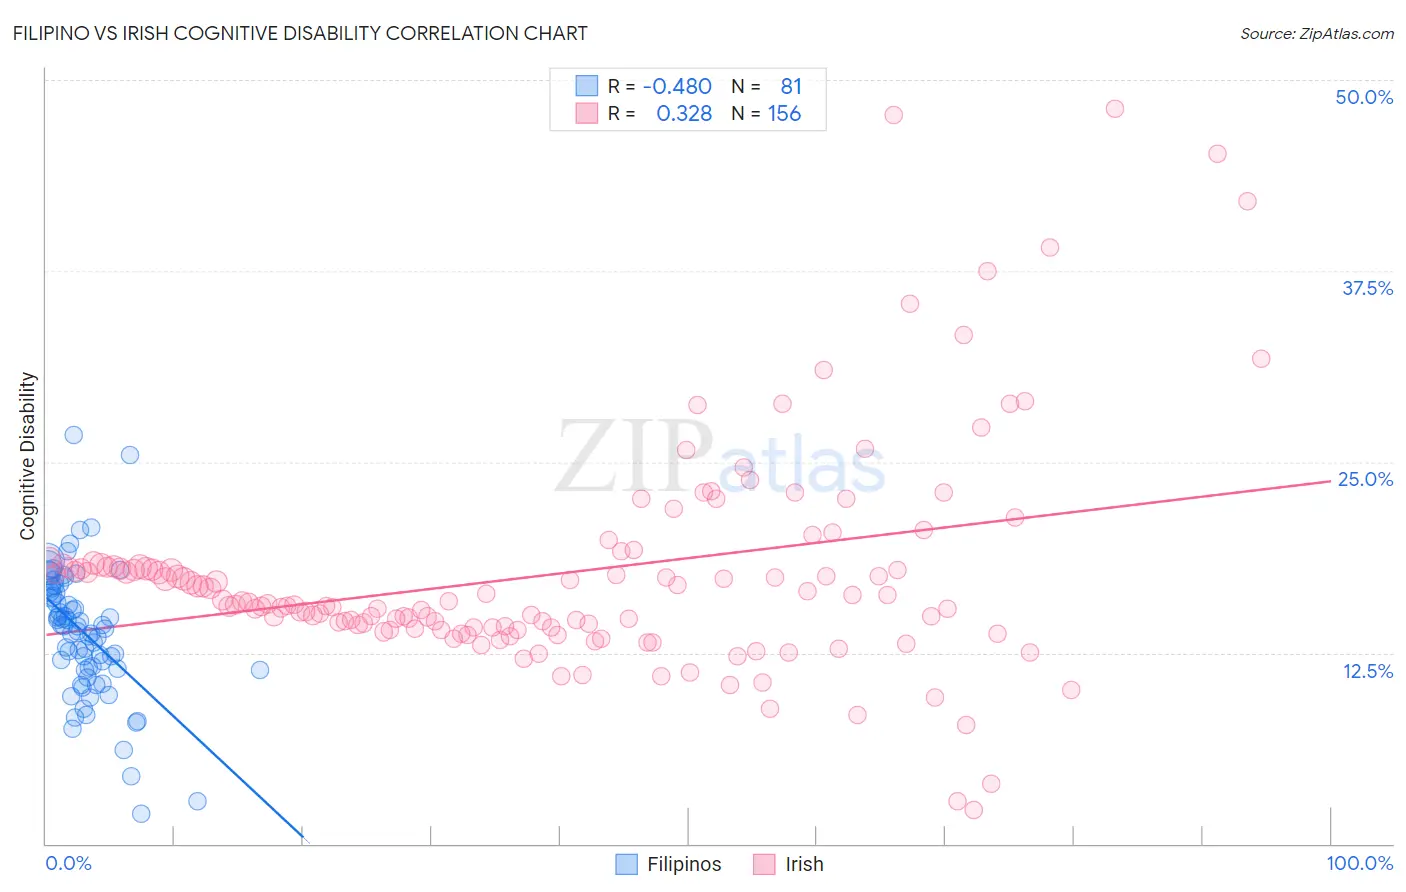
Filipino vs Irish Cognitive Disability Correlation Chart
The statistical analysis conducted on geographies consisting of 254,348,780 people shows a moderate negative correlation between the proportion of Filipinos and percentage of population with cognitive disability in the United States with a correlation coefficient (R) of -0.480 and weighted average of 16.4%. Similarly, the statistical analysis conducted on geographies consisting of 580,428,608 people shows a mild positive correlation between the proportion of Irish and percentage of population with cognitive disability in the United States with a correlation coefficient (R) of 0.328 and weighted average of 16.8%, a difference of 2.5%.
Cognitive Disability Correlation Summary
| Measurement | Filipino | Irish |
| Minimum | 2.0% | 2.2% |
| Maximum | 26.8% | 48.1% |
| Range | 24.8% | 45.9% |
| Mean | 13.8% | 17.7% |
| Median | 14.2% | 15.8% |
| Interquartile 25% (IQ1) | 11.4% | 14.1% |
| Interquartile 75% (IQ3) | 16.6% | 18.1% |
| Interquartile Range (IQR) | 5.2% | 4.0% |
| Standard Deviation (Sample) | 4.3% | 7.3% |
| Standard Deviation (Population) | 4.2% | 7.2% |
Similar Demographics by Cognitive Disability
Demographics Similar to Filipinos by Cognitive Disability
In terms of cognitive disability, the demographic groups most similar to Filipinos are Czech (16.4%, a difference of 0.0%), Immigrants from Romania (16.4%, a difference of 0.020%), Immigrants from Pakistan (16.4%, a difference of 0.030%), Polish (16.4%, a difference of 0.030%), and Immigrants from Croatia (16.4%, a difference of 0.050%).
| Demographics | Rating | Rank | Cognitive Disability |
| Immigrants | South Central Asia | 99.9 /100 | #22 | Exceptional 16.4% |
| Croatians | 99.9 /100 | #23 | Exceptional 16.4% |
| Immigrants | Argentina | 99.9 /100 | #24 | Exceptional 16.4% |
| Luxembourgers | 99.9 /100 | #25 | Exceptional 16.4% |
| Immigrants | Croatia | 99.9 /100 | #26 | Exceptional 16.4% |
| Immigrants | Pakistan | 99.9 /100 | #27 | Exceptional 16.4% |
| Poles | 99.9 /100 | #28 | Exceptional 16.4% |
| Filipinos | 99.9 /100 | #29 | Exceptional 16.4% |
| Czechs | 99.9 /100 | #30 | Exceptional 16.4% |
| Immigrants | Romania | 99.9 /100 | #31 | Exceptional 16.4% |
| Immigrants | Israel | 99.9 /100 | #32 | Exceptional 16.4% |
| Italians | 99.9 /100 | #33 | Exceptional 16.4% |
| Russians | 99.9 /100 | #34 | Exceptional 16.4% |
| Slovaks | 99.9 /100 | #35 | Exceptional 16.4% |
| Greeks | 99.9 /100 | #36 | Exceptional 16.4% |
Demographics Similar to Irish by Cognitive Disability
In terms of cognitive disability, the demographic groups most similar to Irish are Immigrants from Russia (16.8%, a difference of 0.030%), Immigrants from Asia (16.8%, a difference of 0.030%), Paraguayan (16.8%, a difference of 0.050%), Palestinian (16.8%, a difference of 0.050%), and Jordanian (16.8%, a difference of 0.060%).
| Demographics | Rating | Rank | Cognitive Disability |
| English | 98.6 /100 | #95 | Exceptional 16.8% |
| Finns | 98.5 /100 | #96 | Exceptional 16.8% |
| Dutch | 98.5 /100 | #97 | Exceptional 16.8% |
| Immigrants | Lebanon | 98.4 /100 | #98 | Exceptional 16.8% |
| Jordanians | 98.2 /100 | #99 | Exceptional 16.8% |
| Immigrants | Russia | 98.2 /100 | #100 | Exceptional 16.8% |
| Immigrants | Asia | 98.1 /100 | #101 | Exceptional 16.8% |
| Irish | 98.1 /100 | #102 | Exceptional 16.8% |
| Paraguayans | 98.0 /100 | #103 | Exceptional 16.8% |
| Palestinians | 98.0 /100 | #104 | Exceptional 16.8% |
| Immigrants | Eastern Asia | 97.9 /100 | #105 | Exceptional 16.8% |
| Northern Europeans | 97.8 /100 | #106 | Exceptional 16.8% |
| Immigrants | Nicaragua | 97.8 /100 | #107 | Exceptional 16.8% |
| Canadians | 97.5 /100 | #108 | Exceptional 16.8% |
| Albanians | 97.3 /100 | #109 | Exceptional 16.8% |