Fijian vs Immigrants from Syria Disability Age Over 75
COMPARE
Fijian
Immigrants from Syria
Disability Age Over 75
Disability Age Over 75 Comparison
Fijians
Immigrants from Syria
49.0%
DISABILITY AGE OVER 75
0.2/ 100
METRIC RATING
271st/ 347
METRIC RANK
47.8%
DISABILITY AGE OVER 75
17.4/ 100
METRIC RATING
207th/ 347
METRIC RANK
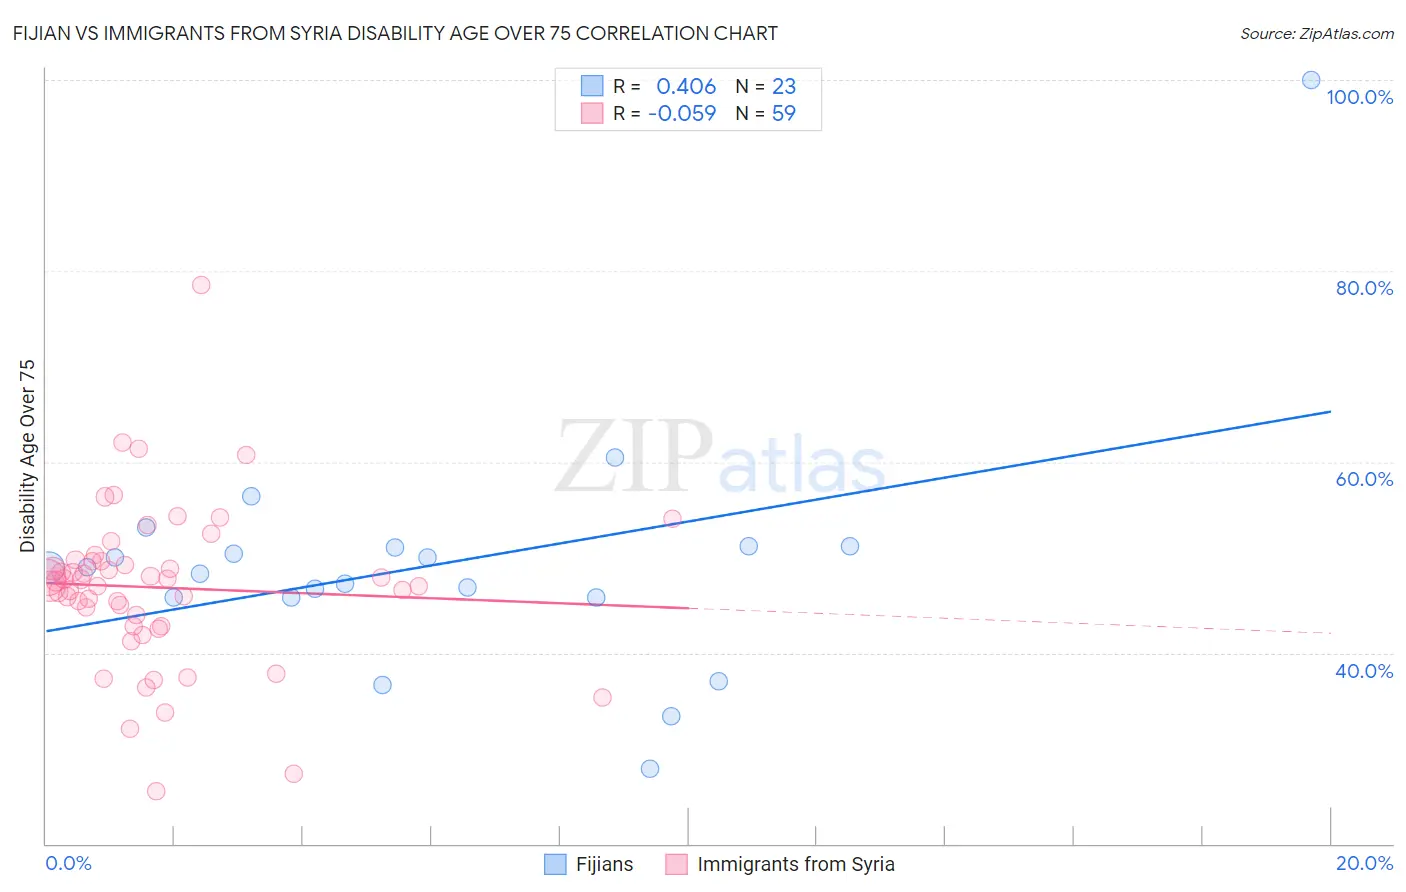
Fijian vs Immigrants from Syria Disability Age Over 75 Correlation Chart
The statistical analysis conducted on geographies consisting of 55,916,518 people shows a moderate positive correlation between the proportion of Fijians and percentage of population with a disability over the age of 75 in the United States with a correlation coefficient (R) of 0.406 and weighted average of 49.0%. Similarly, the statistical analysis conducted on geographies consisting of 174,043,785 people shows a slight negative correlation between the proportion of Immigrants from Syria and percentage of population with a disability over the age of 75 in the United States with a correlation coefficient (R) of -0.059 and weighted average of 47.8%, a difference of 2.7%.
Disability Age Over 75 Correlation Summary
| Measurement | Fijian | Immigrants from Syria |
| Minimum | 27.8% | 25.4% |
| Maximum | 100.0% | 78.6% |
| Range | 72.2% | 53.1% |
| Mean | 49.3% | 46.8% |
| Median | 48.9% | 47.5% |
| Interquartile 25% (IQ1) | 45.8% | 42.8% |
| Interquartile 75% (IQ3) | 51.2% | 49.6% |
| Interquartile Range (IQR) | 5.4% | 6.8% |
| Standard Deviation (Sample) | 13.2% | 8.4% |
| Standard Deviation (Population) | 12.9% | 8.3% |
Similar Demographics by Disability Age Over 75
Demographics Similar to Fijians by Disability Age Over 75
In terms of disability age over 75, the demographic groups most similar to Fijians are Assyrian/Chaldean/Syriac (49.1%, a difference of 0.010%), Potawatomi (49.0%, a difference of 0.020%), Immigrants from El Salvador (49.0%, a difference of 0.050%), Immigrants from Iraq (49.1%, a difference of 0.060%), and Guatemalan (49.0%, a difference of 0.070%).
| Demographics | Rating | Rank | Disability Age Over 75 |
| Immigrants | Honduras | 0.3 /100 | #264 | Tragic 48.9% |
| Hondurans | 0.3 /100 | #265 | Tragic 48.9% |
| U.S. Virgin Islanders | 0.2 /100 | #266 | Tragic 48.9% |
| Malaysians | 0.2 /100 | #267 | Tragic 49.0% |
| Guatemalans | 0.2 /100 | #268 | Tragic 49.0% |
| Immigrants | El Salvador | 0.2 /100 | #269 | Tragic 49.0% |
| Potawatomi | 0.2 /100 | #270 | Tragic 49.0% |
| Fijians | 0.2 /100 | #271 | Tragic 49.0% |
| Assyrians/Chaldeans/Syriacs | 0.2 /100 | #272 | Tragic 49.1% |
| Immigrants | Iraq | 0.1 /100 | #273 | Tragic 49.1% |
| Immigrants | Guatemala | 0.1 /100 | #274 | Tragic 49.1% |
| Immigrants | Dominica | 0.1 /100 | #275 | Tragic 49.1% |
| Immigrants | Uzbekistan | 0.1 /100 | #276 | Tragic 49.2% |
| Hawaiians | 0.1 /100 | #277 | Tragic 49.2% |
| Immigrants | Laos | 0.1 /100 | #278 | Tragic 49.2% |
Demographics Similar to Immigrants from Syria by Disability Age Over 75
In terms of disability age over 75, the demographic groups most similar to Immigrants from Syria are Immigrants from Senegal (47.8%, a difference of 0.020%), Immigrants from Ghana (47.7%, a difference of 0.060%), Jamaican (47.7%, a difference of 0.060%), Nigerian (47.7%, a difference of 0.070%), and Trinidadian and Tobagonian (47.7%, a difference of 0.10%).
| Demographics | Rating | Rank | Disability Age Over 75 |
| Immigrants | Somalia | 21.4 /100 | #200 | Fair 47.7% |
| Immigrants | Cuba | 20.9 /100 | #201 | Fair 47.7% |
| Immigrants | Bahamas | 20.7 /100 | #202 | Fair 47.7% |
| Trinidadians and Tobagonians | 20.0 /100 | #203 | Fair 47.7% |
| Nigerians | 19.2 /100 | #204 | Poor 47.7% |
| Immigrants | Ghana | 19.1 /100 | #205 | Poor 47.7% |
| Jamaicans | 19.0 /100 | #206 | Poor 47.7% |
| Immigrants | Syria | 17.4 /100 | #207 | Poor 47.8% |
| Immigrants | Senegal | 16.9 /100 | #208 | Poor 47.8% |
| Immigrants | Indonesia | 14.2 /100 | #209 | Poor 47.8% |
| Vietnamese | 11.9 /100 | #210 | Poor 47.9% |
| Panamanians | 11.8 /100 | #211 | Poor 47.9% |
| Immigrants | Burma/Myanmar | 11.7 /100 | #212 | Poor 47.9% |
| Laotians | 11.5 /100 | #213 | Poor 47.9% |
| Immigrants | Barbados | 10.7 /100 | #214 | Poor 47.9% |