Fijian vs British West Indian Disability Age Over 75
COMPARE
Fijian
British West Indian
Disability Age Over 75
Disability Age Over 75 Comparison
Fijians
British West Indians
49.0%
DISABILITY AGE OVER 75
0.2/ 100
METRIC RATING
271st/ 347
METRIC RANK
48.7%
DISABILITY AGE OVER 75
0.6/ 100
METRIC RATING
253rd/ 347
METRIC RANK
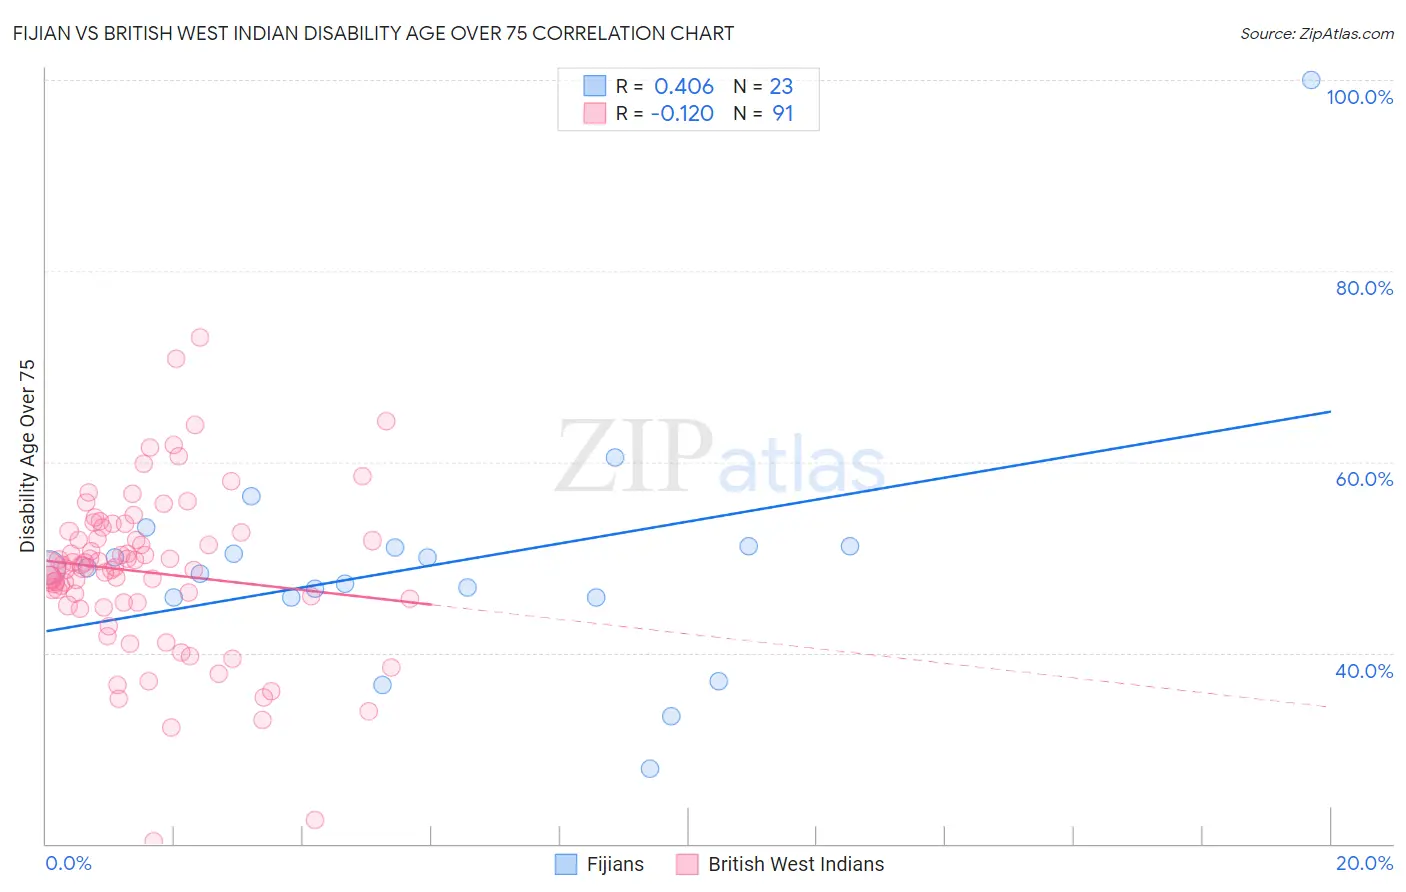
Fijian vs British West Indian Disability Age Over 75 Correlation Chart
The statistical analysis conducted on geographies consisting of 55,916,518 people shows a moderate positive correlation between the proportion of Fijians and percentage of population with a disability over the age of 75 in the United States with a correlation coefficient (R) of 0.406 and weighted average of 49.0%. Similarly, the statistical analysis conducted on geographies consisting of 152,453,747 people shows a poor negative correlation between the proportion of British West Indians and percentage of population with a disability over the age of 75 in the United States with a correlation coefficient (R) of -0.120 and weighted average of 48.7%, a difference of 0.73%.
Disability Age Over 75 Correlation Summary
| Measurement | Fijian | British West Indian |
| Minimum | 27.8% | 20.3% |
| Maximum | 100.0% | 73.0% |
| Range | 72.2% | 52.8% |
| Mean | 49.3% | 48.4% |
| Median | 48.9% | 48.9% |
| Interquartile 25% (IQ1) | 45.8% | 45.2% |
| Interquartile 75% (IQ3) | 51.2% | 52.8% |
| Interquartile Range (IQR) | 5.4% | 7.5% |
| Standard Deviation (Sample) | 13.2% | 8.6% |
| Standard Deviation (Population) | 12.9% | 8.6% |
Demographics Similar to Fijians and British West Indians by Disability Age Over 75
In terms of disability age over 75, the demographic groups most similar to Fijians are Assyrian/Chaldean/Syriac (49.1%, a difference of 0.010%), Potawatomi (49.0%, a difference of 0.020%), Immigrants from El Salvador (49.0%, a difference of 0.050%), Guatemalan (49.0%, a difference of 0.070%), and Malaysian (49.0%, a difference of 0.080%). Similarly, the demographic groups most similar to British West Indians are Immigrants from Vietnam (48.7%, a difference of 0.030%), Immigrants from South Eastern Asia (48.7%, a difference of 0.040%), Chinese (48.7%, a difference of 0.070%), Immigrants from Congo (48.7%, a difference of 0.080%), and Blackfeet (48.8%, a difference of 0.14%).
| Demographics | Rating | Rank | Disability Age Over 75 |
| Immigrants | South Eastern Asia | 0.7 /100 | #252 | Tragic 48.7% |
| British West Indians | 0.6 /100 | #253 | Tragic 48.7% |
| Immigrants | Vietnam | 0.6 /100 | #254 | Tragic 48.7% |
| Chinese | 0.5 /100 | #255 | Tragic 48.7% |
| Immigrants | Congo | 0.5 /100 | #256 | Tragic 48.7% |
| Blackfeet | 0.5 /100 | #257 | Tragic 48.8% |
| Immigrants | Philippines | 0.4 /100 | #258 | Tragic 48.8% |
| Central Americans | 0.4 /100 | #259 | Tragic 48.8% |
| Immigrants | Afghanistan | 0.4 /100 | #260 | Tragic 48.8% |
| Africans | 0.3 /100 | #261 | Tragic 48.9% |
| Immigrants | West Indies | 0.3 /100 | #262 | Tragic 48.9% |
| Salvadorans | 0.3 /100 | #263 | Tragic 48.9% |
| Immigrants | Honduras | 0.3 /100 | #264 | Tragic 48.9% |
| Hondurans | 0.3 /100 | #265 | Tragic 48.9% |
| U.S. Virgin Islanders | 0.2 /100 | #266 | Tragic 48.9% |
| Malaysians | 0.2 /100 | #267 | Tragic 49.0% |
| Guatemalans | 0.2 /100 | #268 | Tragic 49.0% |
| Immigrants | El Salvador | 0.2 /100 | #269 | Tragic 49.0% |
| Potawatomi | 0.2 /100 | #270 | Tragic 49.0% |
| Fijians | 0.2 /100 | #271 | Tragic 49.0% |
| Assyrians/Chaldeans/Syriacs | 0.2 /100 | #272 | Tragic 49.1% |