Immigrants from Croatia vs Immigrants from Sri Lanka Cognitive Disability
COMPARE
Immigrants from Croatia
Immigrants from Sri Lanka
Cognitive Disability
Cognitive Disability Comparison
Immigrants from Croatia
Immigrants from Sri Lanka
16.4%
COGNITIVE DISABILITY
99.9/ 100
METRIC RATING
26th/ 347
METRIC RANK
16.8%
COGNITIVE DISABILITY
97.1/ 100
METRIC RATING
113th/ 347
METRIC RANK
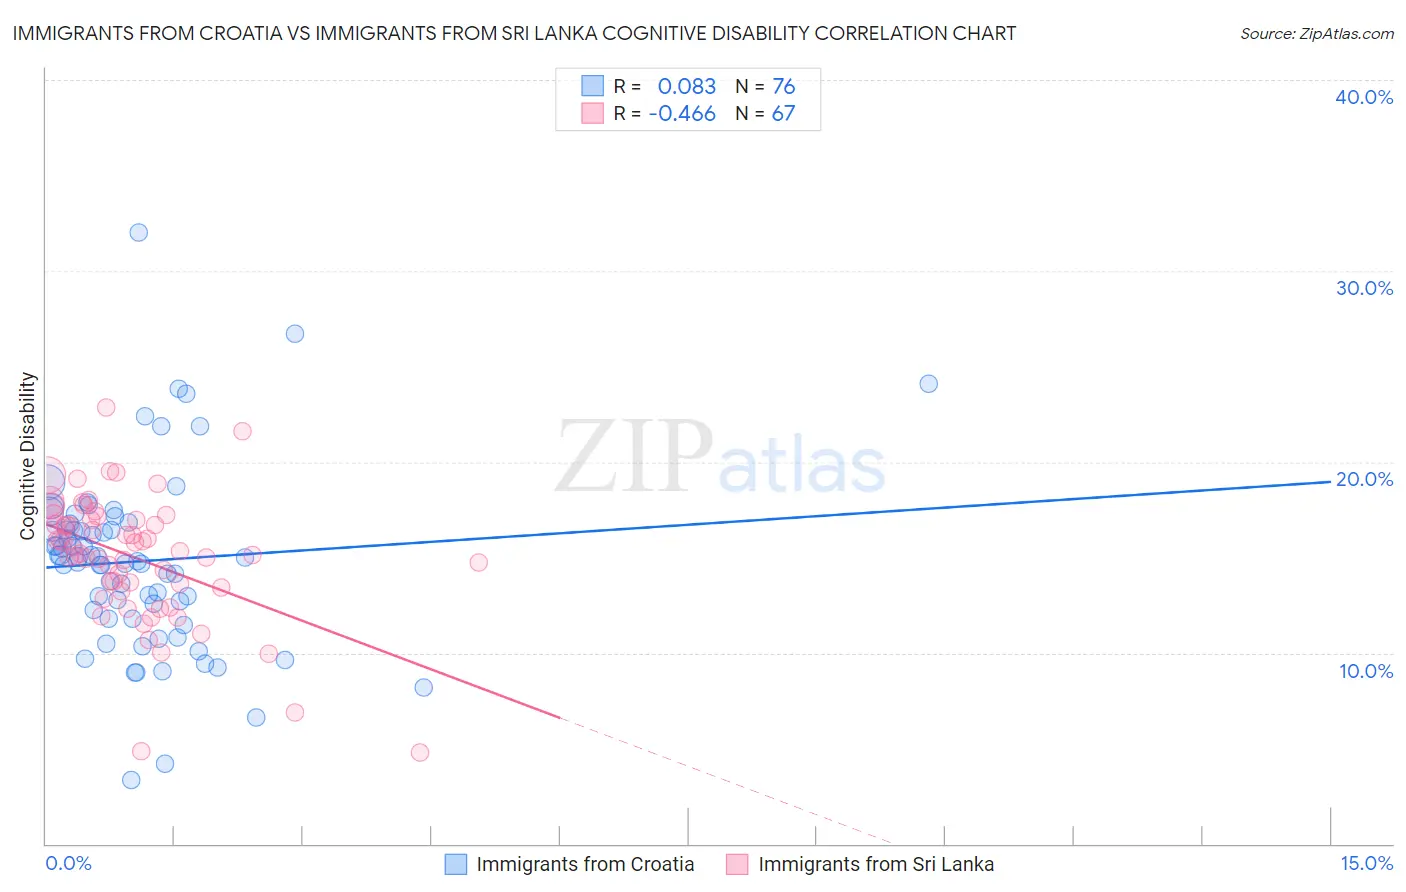
Immigrants from Croatia vs Immigrants from Sri Lanka Cognitive Disability Correlation Chart
The statistical analysis conducted on geographies consisting of 132,576,983 people shows a slight positive correlation between the proportion of Immigrants from Croatia and percentage of population with cognitive disability in the United States with a correlation coefficient (R) of 0.083 and weighted average of 16.4%. Similarly, the statistical analysis conducted on geographies consisting of 149,697,032 people shows a moderate negative correlation between the proportion of Immigrants from Sri Lanka and percentage of population with cognitive disability in the United States with a correlation coefficient (R) of -0.466 and weighted average of 16.8%, a difference of 2.8%.
Cognitive Disability Correlation Summary
| Measurement | Immigrants from Croatia | Immigrants from Sri Lanka |
| Minimum | 3.4% | 4.8% |
| Maximum | 32.0% | 22.9% |
| Range | 28.6% | 18.1% |
| Mean | 14.8% | 15.0% |
| Median | 14.9% | 15.3% |
| Interquartile 25% (IQ1) | 12.0% | 13.4% |
| Interquartile 75% (IQ3) | 16.6% | 17.0% |
| Interquartile Range (IQR) | 4.6% | 3.6% |
| Standard Deviation (Sample) | 4.7% | 3.3% |
| Standard Deviation (Population) | 4.7% | 3.3% |
Similar Demographics by Cognitive Disability
Demographics Similar to Immigrants from Croatia by Cognitive Disability
In terms of cognitive disability, the demographic groups most similar to Immigrants from Croatia are Immigrants from Pakistan (16.4%, a difference of 0.020%), Polish (16.4%, a difference of 0.020%), Luxembourger (16.4%, a difference of 0.030%), Filipino (16.4%, a difference of 0.050%), and Czech (16.4%, a difference of 0.050%).
| Demographics | Rating | Rank | Cognitive Disability |
| Immigrants | Bolivia | 100.0 /100 | #19 | Exceptional 16.3% |
| Bulgarians | 100.0 /100 | #20 | Exceptional 16.3% |
| Immigrants | Cuba | 100.0 /100 | #21 | Exceptional 16.3% |
| Immigrants | South Central Asia | 99.9 /100 | #22 | Exceptional 16.4% |
| Croatians | 99.9 /100 | #23 | Exceptional 16.4% |
| Immigrants | Argentina | 99.9 /100 | #24 | Exceptional 16.4% |
| Luxembourgers | 99.9 /100 | #25 | Exceptional 16.4% |
| Immigrants | Croatia | 99.9 /100 | #26 | Exceptional 16.4% |
| Immigrants | Pakistan | 99.9 /100 | #27 | Exceptional 16.4% |
| Poles | 99.9 /100 | #28 | Exceptional 16.4% |
| Filipinos | 99.9 /100 | #29 | Exceptional 16.4% |
| Czechs | 99.9 /100 | #30 | Exceptional 16.4% |
| Immigrants | Romania | 99.9 /100 | #31 | Exceptional 16.4% |
| Immigrants | Israel | 99.9 /100 | #32 | Exceptional 16.4% |
| Italians | 99.9 /100 | #33 | Exceptional 16.4% |
Demographics Similar to Immigrants from Sri Lanka by Cognitive Disability
In terms of cognitive disability, the demographic groups most similar to Immigrants from Sri Lanka are Indian (Asian) (16.8%, a difference of 0.0%), Korean (16.8%, a difference of 0.0%), Uruguayan (16.8%, a difference of 0.030%), Arapaho (16.8%, a difference of 0.040%), and Albanian (16.8%, a difference of 0.050%).
| Demographics | Rating | Rank | Cognitive Disability |
| Northern Europeans | 97.8 /100 | #106 | Exceptional 16.8% |
| Immigrants | Nicaragua | 97.8 /100 | #107 | Exceptional 16.8% |
| Canadians | 97.5 /100 | #108 | Exceptional 16.8% |
| Albanians | 97.3 /100 | #109 | Exceptional 16.8% |
| Arapaho | 97.3 /100 | #110 | Exceptional 16.8% |
| Uruguayans | 97.2 /100 | #111 | Exceptional 16.8% |
| Indians (Asian) | 97.2 /100 | #112 | Exceptional 16.8% |
| Immigrants | Sri Lanka | 97.1 /100 | #113 | Exceptional 16.8% |
| Koreans | 97.1 /100 | #114 | Exceptional 16.8% |
| Yup'ik | 96.9 /100 | #115 | Exceptional 16.9% |
| Inupiat | 96.5 /100 | #116 | Exceptional 16.9% |
| Immigrants | Japan | 96.2 /100 | #117 | Exceptional 16.9% |
| Immigrants | Denmark | 96.2 /100 | #118 | Exceptional 16.9% |
| South Africans | 95.5 /100 | #119 | Exceptional 16.9% |
| Scottish | 95.0 /100 | #120 | Exceptional 16.9% |