Estonian vs Polish Vision Disability
COMPARE
Estonian
Polish
Vision Disability
Vision Disability Comparison
Estonians
Poles
2.1%
VISION DISABILITY
95.3/ 100
METRIC RATING
99th/ 347
METRIC RANK
2.1%
VISION DISABILITY
92.0/ 100
METRIC RATING
117th/ 347
METRIC RANK
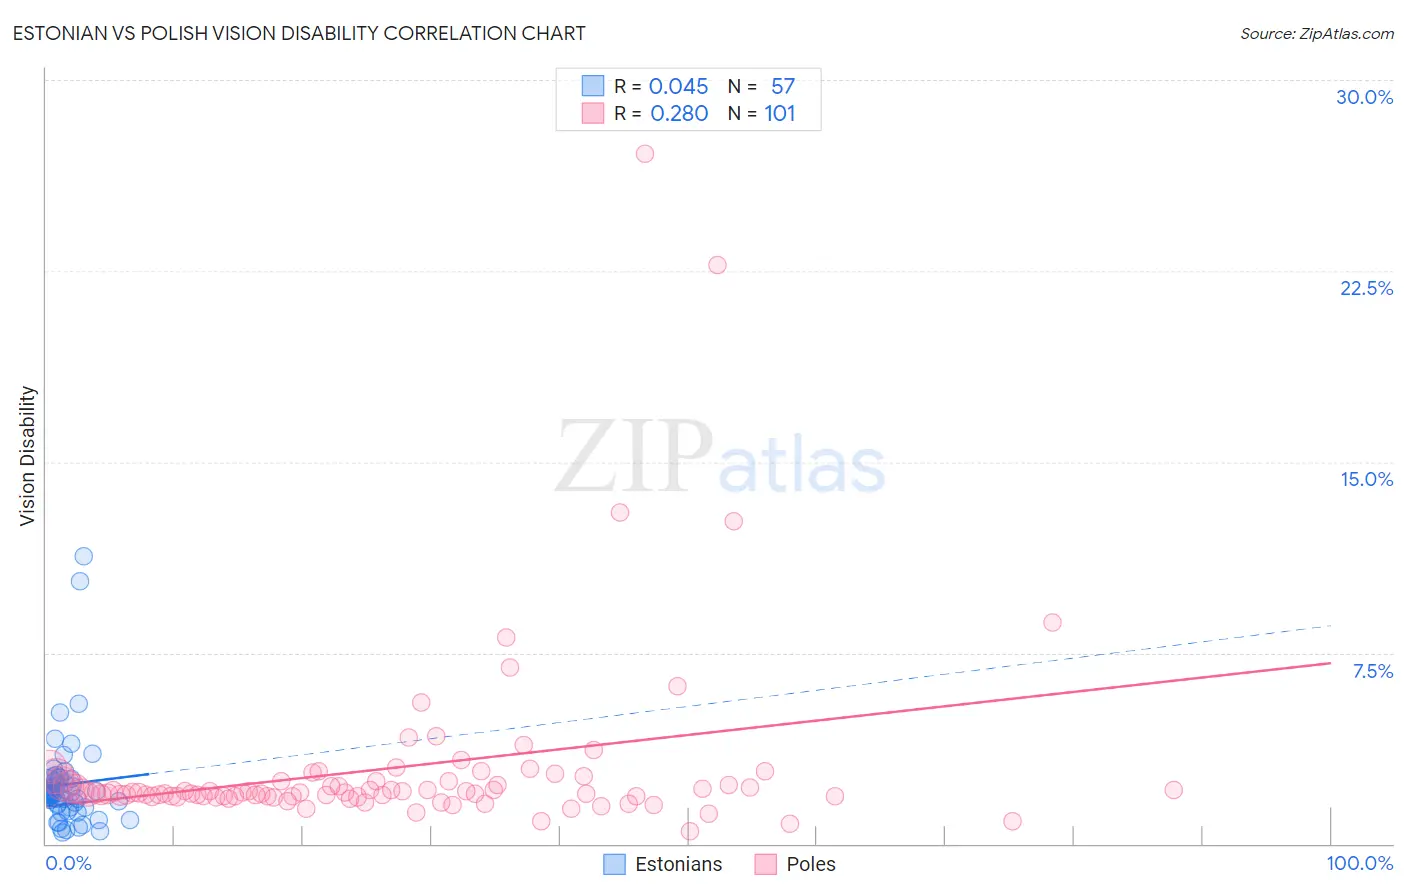
Estonian vs Polish Vision Disability Correlation Chart
The statistical analysis conducted on geographies consisting of 123,516,084 people shows no correlation between the proportion of Estonians and percentage of population with vision disability in the United States with a correlation coefficient (R) of 0.045 and weighted average of 2.1%. Similarly, the statistical analysis conducted on geographies consisting of 558,655,799 people shows a weak positive correlation between the proportion of Poles and percentage of population with vision disability in the United States with a correlation coefficient (R) of 0.280 and weighted average of 2.1%, a difference of 0.92%.
Vision Disability Correlation Summary
| Measurement | Estonian | Polish |
| Minimum | 0.45% | 0.47% |
| Maximum | 11.3% | 27.1% |
| Range | 10.8% | 26.7% |
| Mean | 2.3% | 3.0% |
| Median | 2.0% | 2.0% |
| Interquartile 25% (IQ1) | 1.4% | 1.9% |
| Interquartile 75% (IQ3) | 2.6% | 2.5% |
| Interquartile Range (IQR) | 1.1% | 0.60% |
| Standard Deviation (Sample) | 1.9% | 3.7% |
| Standard Deviation (Population) | 1.9% | 3.7% |
Demographics Similar to Estonians and Poles by Vision Disability
In terms of vision disability, the demographic groups most similar to Estonians are Greek (2.1%, a difference of 0.040%), Immigrants from South Africa (2.1%, a difference of 0.070%), Albanian (2.1%, a difference of 0.12%), Sri Lankan (2.1%, a difference of 0.15%), and Immigrants from Austria (2.1%, a difference of 0.29%). Similarly, the demographic groups most similar to Poles are Ugandan (2.1%, a difference of 0.040%), Immigrants from Vietnam (2.1%, a difference of 0.050%), Croatian (2.1%, a difference of 0.070%), Kenyan (2.1%, a difference of 0.11%), and Immigrants from Philippines (2.1%, a difference of 0.13%).
| Demographics | Rating | Rank | Vision Disability |
| Immigrants | South Africa | 95.4 /100 | #98 | Exceptional 2.1% |
| Estonians | 95.3 /100 | #99 | Exceptional 2.1% |
| Greeks | 95.1 /100 | #100 | Exceptional 2.1% |
| Albanians | 94.9 /100 | #101 | Exceptional 2.1% |
| Sri Lankans | 94.8 /100 | #102 | Exceptional 2.1% |
| Immigrants | Austria | 94.4 /100 | #103 | Exceptional 2.1% |
| Immigrants | Italy | 94.4 /100 | #104 | Exceptional 2.1% |
| Carpatho Rusyns | 94.3 /100 | #105 | Exceptional 2.1% |
| Swedes | 94.2 /100 | #106 | Exceptional 2.1% |
| Danes | 94.2 /100 | #107 | Exceptional 2.1% |
| Koreans | 94.1 /100 | #108 | Exceptional 2.1% |
| Chileans | 94.0 /100 | #109 | Exceptional 2.1% |
| Immigrants | Armenia | 93.8 /100 | #110 | Exceptional 2.1% |
| Peruvians | 93.5 /100 | #111 | Exceptional 2.1% |
| Immigrants | Denmark | 92.9 /100 | #112 | Exceptional 2.1% |
| Kenyans | 92.5 /100 | #113 | Exceptional 2.1% |
| Croatians | 92.3 /100 | #114 | Exceptional 2.1% |
| Immigrants | Vietnam | 92.2 /100 | #115 | Exceptional 2.1% |
| Ugandans | 92.2 /100 | #116 | Exceptional 2.1% |
| Poles | 92.0 /100 | #117 | Exceptional 2.1% |
| Immigrants | Philippines | 91.4 /100 | #118 | Exceptional 2.1% |