Mexican vs Immigrants from Argentina Female Disability
COMPARE
Mexican
Immigrants from Argentina
Female Disability
Female Disability Comparison
Mexicans
Immigrants from Argentina
12.4%
FEMALE DISABILITY
15.7/ 100
METRIC RATING
209th/ 347
METRIC RANK
11.0%
FEMALE DISABILITY
100.0/ 100
METRIC RATING
24th/ 347
METRIC RANK
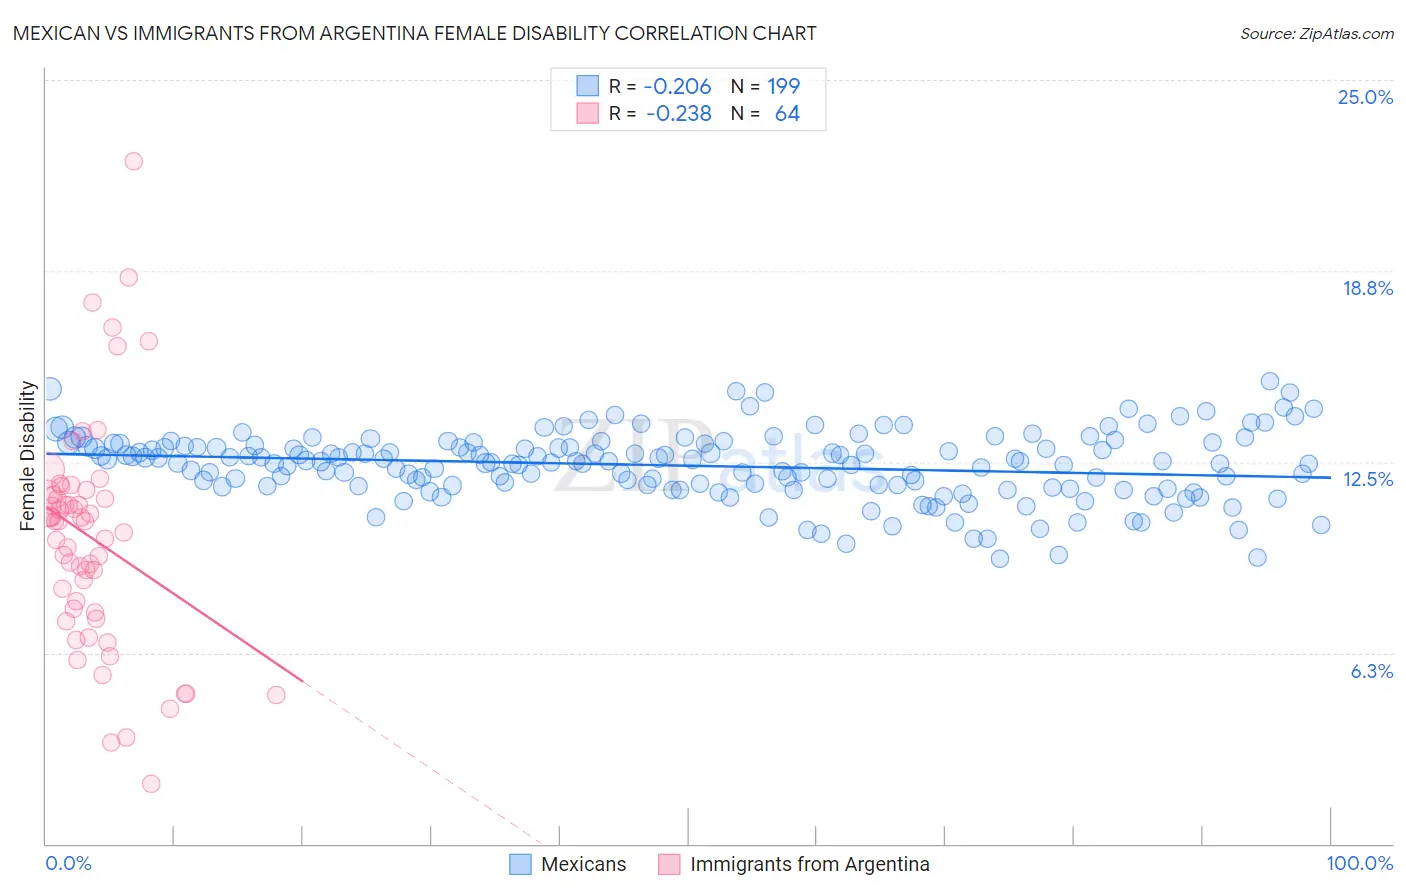
Mexican vs Immigrants from Argentina Female Disability Correlation Chart
The statistical analysis conducted on geographies consisting of 564,937,802 people shows a weak negative correlation between the proportion of Mexicans and percentage of females with a disability in the United States with a correlation coefficient (R) of -0.206 and weighted average of 12.4%. Similarly, the statistical analysis conducted on geographies consisting of 264,430,891 people shows a weak negative correlation between the proportion of Immigrants from Argentina and percentage of females with a disability in the United States with a correlation coefficient (R) of -0.238 and weighted average of 11.0%, a difference of 12.5%.
Female Disability Correlation Summary
| Measurement | Mexican | Immigrants from Argentina |
| Minimum | 9.3% | 1.9% |
| Maximum | 15.1% | 22.3% |
| Range | 5.8% | 20.4% |
| Mean | 12.4% | 10.0% |
| Median | 12.5% | 10.6% |
| Interquartile 25% (IQ1) | 11.7% | 7.6% |
| Interquartile 75% (IQ3) | 13.0% | 11.5% |
| Interquartile Range (IQR) | 1.3% | 3.8% |
| Standard Deviation (Sample) | 1.1% | 3.7% |
| Standard Deviation (Population) | 1.1% | 3.7% |
Similar Demographics by Female Disability
Demographics Similar to Mexicans by Female Disability
In terms of female disability, the demographic groups most similar to Mexicans are Swiss (12.4%, a difference of 0.050%), Immigrants from Bosnia and Herzegovina (12.4%, a difference of 0.060%), Ute (12.4%, a difference of 0.070%), Immigrants from Thailand (12.4%, a difference of 0.090%), and Basque (12.4%, a difference of 0.12%).
| Demographics | Rating | Rank | Female Disability |
| Somalis | 21.5 /100 | #202 | Fair 12.3% |
| Immigrants | Barbados | 21.1 /100 | #203 | Fair 12.3% |
| Immigrants | Zaire | 20.9 /100 | #204 | Fair 12.3% |
| Immigrants | Grenada | 20.5 /100 | #205 | Fair 12.4% |
| Immigrants | Cuba | 20.2 /100 | #206 | Fair 12.4% |
| Croatians | 20.2 /100 | #207 | Fair 12.4% |
| Basques | 17.5 /100 | #208 | Poor 12.4% |
| Mexicans | 15.7 /100 | #209 | Poor 12.4% |
| Swiss | 14.9 /100 | #210 | Poor 12.4% |
| Immigrants | Bosnia and Herzegovina | 14.8 /100 | #211 | Poor 12.4% |
| Ute | 14.7 /100 | #212 | Poor 12.4% |
| Immigrants | Thailand | 14.5 /100 | #213 | Poor 12.4% |
| Panamanians | 13.5 /100 | #214 | Poor 12.4% |
| Samoans | 13.4 /100 | #215 | Poor 12.4% |
| Immigrants | Burma/Myanmar | 13.3 /100 | #216 | Poor 12.4% |
Demographics Similar to Immigrants from Argentina by Female Disability
In terms of female disability, the demographic groups most similar to Immigrants from Argentina are Immigrants from Asia (11.0%, a difference of 0.030%), Argentinean (11.0%, a difference of 0.070%), Immigrants from Turkey (11.1%, a difference of 0.47%), Venezuelan (11.0%, a difference of 0.57%), and Egyptian (11.1%, a difference of 0.74%).
| Demographics | Rating | Rank | Female Disability |
| Indians (Asian) | 100.0 /100 | #17 | Exceptional 10.8% |
| Immigrants | Iran | 100.0 /100 | #18 | Exceptional 10.8% |
| Immigrants | Venezuela | 100.0 /100 | #19 | Exceptional 10.9% |
| Immigrants | Pakistan | 100.0 /100 | #20 | Exceptional 10.9% |
| Asians | 100.0 /100 | #21 | Exceptional 10.9% |
| Immigrants | Sri Lanka | 100.0 /100 | #22 | Exceptional 10.9% |
| Venezuelans | 100.0 /100 | #23 | Exceptional 11.0% |
| Immigrants | Argentina | 100.0 /100 | #24 | Exceptional 11.0% |
| Immigrants | Asia | 100.0 /100 | #25 | Exceptional 11.0% |
| Argentineans | 100.0 /100 | #26 | Exceptional 11.0% |
| Immigrants | Turkey | 100.0 /100 | #27 | Exceptional 11.1% |
| Egyptians | 100.0 /100 | #28 | Exceptional 11.1% |
| Immigrants | Malaysia | 100.0 /100 | #29 | Exceptional 11.1% |
| Turks | 100.0 /100 | #30 | Exceptional 11.1% |
| Immigrants | Kuwait | 100.0 /100 | #31 | Exceptional 11.1% |