Egyptian vs Immigrants from Nigeria Bachelor's Degree
COMPARE
Egyptian
Immigrants from Nigeria
Bachelor's Degree
Bachelor's Degree Comparison
Egyptians
Immigrants from Nigeria
43.3%
BACHELOR'S DEGREE
99.7/ 100
METRIC RATING
67th/ 347
METRIC RANK
36.7%
BACHELOR'S DEGREE
23.1/ 100
METRIC RATING
203rd/ 347
METRIC RANK
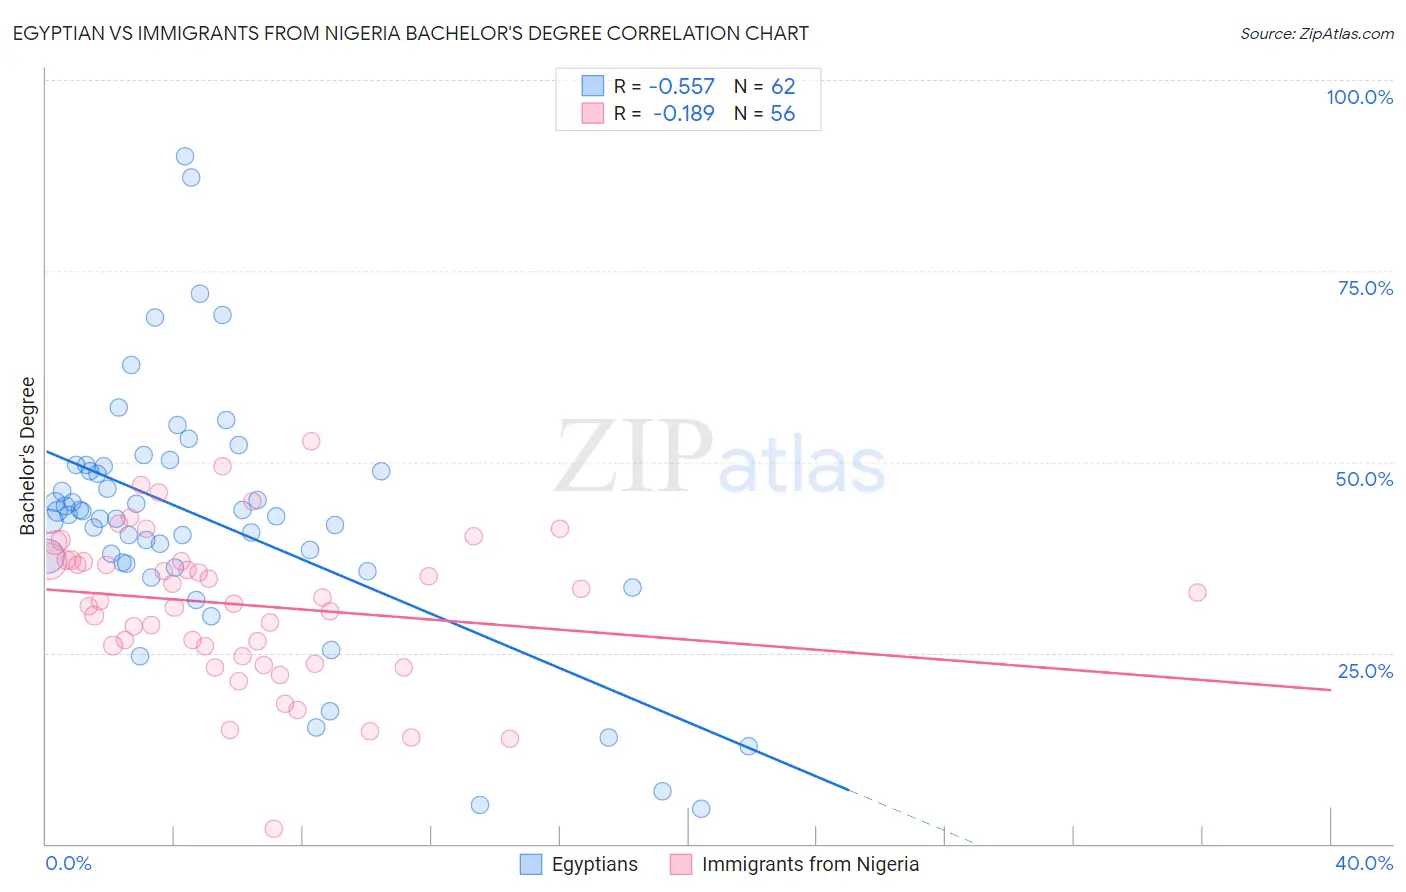
Egyptian vs Immigrants from Nigeria Bachelor's Degree Correlation Chart
The statistical analysis conducted on geographies consisting of 276,908,448 people shows a substantial negative correlation between the proportion of Egyptians and percentage of population with at least bachelor's degree education in the United States with a correlation coefficient (R) of -0.557 and weighted average of 43.3%. Similarly, the statistical analysis conducted on geographies consisting of 283,462,010 people shows a poor negative correlation between the proportion of Immigrants from Nigeria and percentage of population with at least bachelor's degree education in the United States with a correlation coefficient (R) of -0.189 and weighted average of 36.7%, a difference of 17.8%.
Bachelor's Degree Correlation Summary
| Measurement | Egyptian | Immigrants from Nigeria |
| Minimum | 4.6% | 2.0% |
| Maximum | 90.0% | 52.6% |
| Range | 85.4% | 50.6% |
| Mean | 42.3% | 31.3% |
| Median | 43.0% | 32.1% |
| Interquartile 25% (IQ1) | 36.6% | 25.2% |
| Interquartile 75% (IQ3) | 49.5% | 37.0% |
| Interquartile Range (IQR) | 12.8% | 11.8% |
| Standard Deviation (Sample) | 16.5% | 9.9% |
| Standard Deviation (Population) | 16.3% | 9.8% |
Similar Demographics by Bachelor's Degree
Demographics Similar to Egyptians by Bachelor's Degree
In terms of bachelor's degree, the demographic groups most similar to Egyptians are Immigrants from Netherlands (43.3%, a difference of 0.020%), Immigrants from Indonesia (43.3%, a difference of 0.020%), Zimbabwean (43.3%, a difference of 0.040%), Argentinean (43.3%, a difference of 0.050%), and Immigrants from Pakistan (43.1%, a difference of 0.28%).
| Demographics | Rating | Rank | Bachelor's Degree |
| New Zealanders | 99.9 /100 | #60 | Exceptional 44.0% |
| South Africans | 99.8 /100 | #61 | Exceptional 43.6% |
| Immigrants | Kazakhstan | 99.8 /100 | #62 | Exceptional 43.4% |
| Immigrants | Europe | 99.8 /100 | #63 | Exceptional 43.4% |
| Argentineans | 99.7 /100 | #64 | Exceptional 43.3% |
| Zimbabweans | 99.7 /100 | #65 | Exceptional 43.3% |
| Immigrants | Netherlands | 99.7 /100 | #66 | Exceptional 43.3% |
| Egyptians | 99.7 /100 | #67 | Exceptional 43.3% |
| Immigrants | Indonesia | 99.7 /100 | #68 | Exceptional 43.3% |
| Immigrants | Pakistan | 99.7 /100 | #69 | Exceptional 43.1% |
| Immigrants | Romania | 99.6 /100 | #70 | Exceptional 42.9% |
| Immigrants | Argentina | 99.6 /100 | #71 | Exceptional 42.8% |
| Ethiopians | 99.5 /100 | #72 | Exceptional 42.8% |
| Immigrants | Uzbekistan | 99.5 /100 | #73 | Exceptional 42.8% |
| Bhutanese | 99.5 /100 | #74 | Exceptional 42.7% |
Demographics Similar to Immigrants from Nigeria by Bachelor's Degree
In terms of bachelor's degree, the demographic groups most similar to Immigrants from Nigeria are Immigrants (36.7%, a difference of 0.040%), Finnish (36.7%, a difference of 0.14%), Spaniard (36.6%, a difference of 0.28%), Immigrants from Zaire (36.8%, a difference of 0.29%), and Immigrants from South Eastern Asia (36.8%, a difference of 0.31%).
| Demographics | Rating | Rank | Bachelor's Degree |
| Celtics | 29.5 /100 | #196 | Fair 37.0% |
| Czechoslovakians | 29.2 /100 | #197 | Fair 37.0% |
| Welsh | 29.1 /100 | #198 | Fair 37.0% |
| Immigrants | Costa Rica | 27.4 /100 | #199 | Fair 36.9% |
| Immigrants | Ghana | 27.4 /100 | #200 | Fair 36.9% |
| Immigrants | South Eastern Asia | 25.4 /100 | #201 | Fair 36.8% |
| Immigrants | Zaire | 25.3 /100 | #202 | Fair 36.8% |
| Immigrants | Nigeria | 23.1 /100 | #203 | Fair 36.7% |
| Immigrants | Immigrants | 22.8 /100 | #204 | Fair 36.7% |
| Finns | 22.2 /100 | #205 | Fair 36.7% |
| Spaniards | 21.2 /100 | #206 | Fair 36.6% |
| Immigrants | Middle Africa | 20.6 /100 | #207 | Fair 36.6% |
| Immigrants | Thailand | 19.4 /100 | #208 | Poor 36.5% |
| Panamanians | 18.8 /100 | #209 | Poor 36.5% |
| French | 18.6 /100 | #210 | Poor 36.5% |