Ecuadorian vs Puerto Rican Cognitive Disability
COMPARE
Ecuadorian
Puerto Rican
Cognitive Disability
Cognitive Disability Comparison
Ecuadorians
Puerto Ricans
17.2%
COGNITIVE DISABILITY
59.6/ 100
METRIC RATING
170th/ 347
METRIC RANK
19.2%
COGNITIVE DISABILITY
0.0/ 100
METRIC RATING
339th/ 347
METRIC RANK
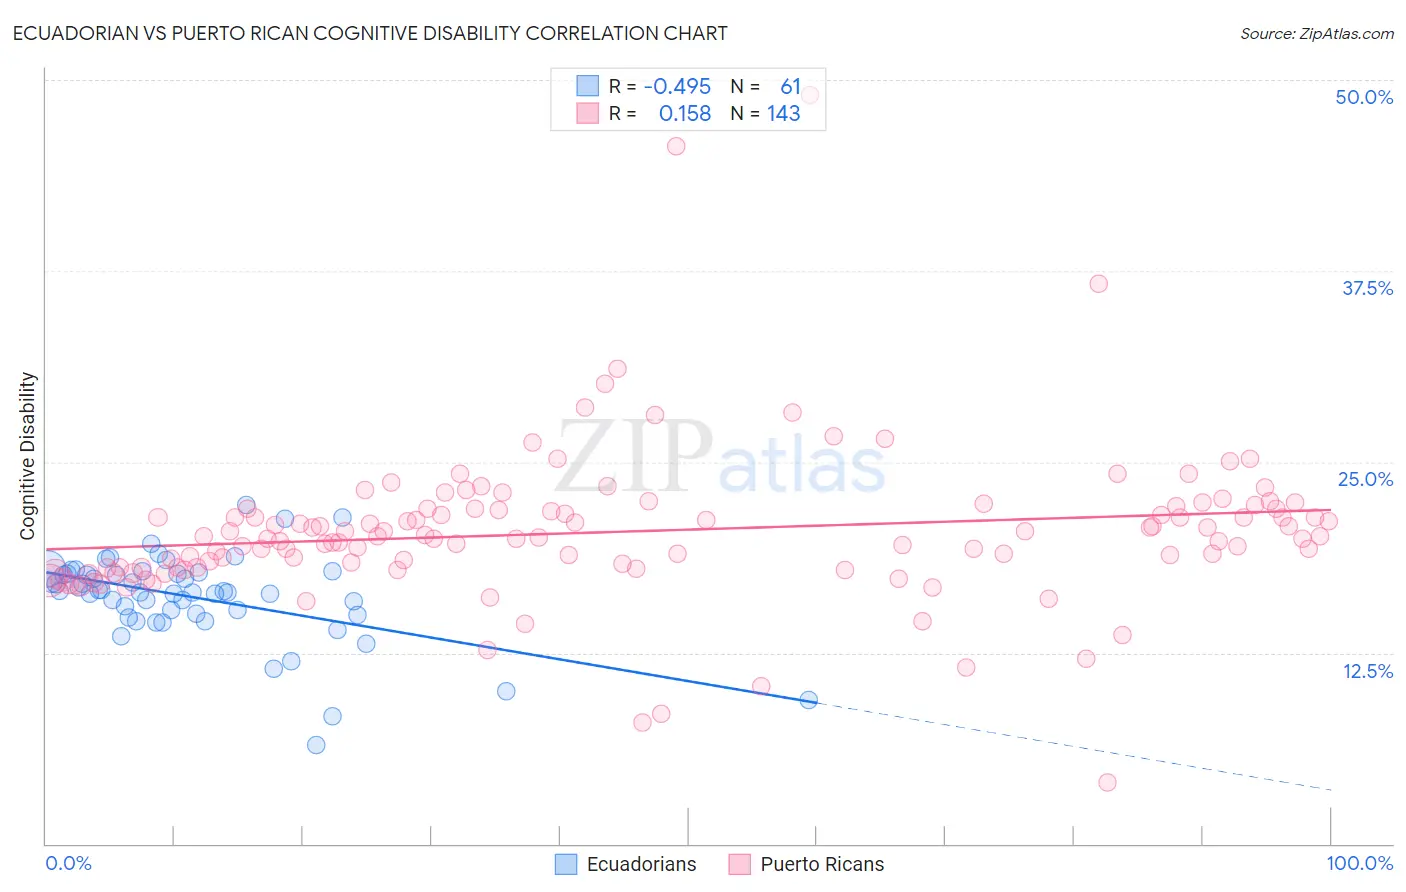
Ecuadorian vs Puerto Rican Cognitive Disability Correlation Chart
The statistical analysis conducted on geographies consisting of 317,812,387 people shows a moderate negative correlation between the proportion of Ecuadorians and percentage of population with cognitive disability in the United States with a correlation coefficient (R) of -0.495 and weighted average of 17.2%. Similarly, the statistical analysis conducted on geographies consisting of 528,170,098 people shows a poor positive correlation between the proportion of Puerto Ricans and percentage of population with cognitive disability in the United States with a correlation coefficient (R) of 0.158 and weighted average of 19.2%, a difference of 11.5%.
Cognitive Disability Correlation Summary
| Measurement | Ecuadorian | Puerto Rican |
| Minimum | 6.5% | 4.0% |
| Maximum | 22.2% | 49.0% |
| Range | 15.7% | 44.9% |
| Mean | 16.2% | 20.4% |
| Median | 16.5% | 20.1% |
| Interquartile 25% (IQ1) | 15.0% | 18.1% |
| Interquartile 75% (IQ3) | 17.7% | 21.9% |
| Interquartile Range (IQR) | 2.7% | 3.8% |
| Standard Deviation (Sample) | 2.9% | 5.2% |
| Standard Deviation (Population) | 2.8% | 5.1% |
Similar Demographics by Cognitive Disability
Demographics Similar to Ecuadorians by Cognitive Disability
In terms of cognitive disability, the demographic groups most similar to Ecuadorians are Tlingit-Haida (17.2%, a difference of 0.0%), Immigrants from Portugal (17.2%, a difference of 0.070%), Immigrants (17.2%, a difference of 0.090%), Immigrants from Turkey (17.2%, a difference of 0.090%), and Immigrants from Syria (17.2%, a difference of 0.12%).
| Demographics | Rating | Rank | Cognitive Disability |
| Immigrants | Switzerland | 71.5 /100 | #163 | Good 17.2% |
| Armenians | 70.1 /100 | #164 | Good 17.2% |
| Immigrants | Albania | 64.9 /100 | #165 | Good 17.2% |
| Immigrants | Ecuador | 64.4 /100 | #166 | Good 17.2% |
| Immigrants | Syria | 63.5 /100 | #167 | Good 17.2% |
| Immigrants | Immigrants | 62.5 /100 | #168 | Good 17.2% |
| Immigrants | Portugal | 61.8 /100 | #169 | Good 17.2% |
| Ecuadorians | 59.6 /100 | #170 | Average 17.2% |
| Tlingit-Haida | 59.4 /100 | #171 | Average 17.2% |
| Immigrants | Turkey | 56.7 /100 | #172 | Average 17.2% |
| Immigrants | Northern Africa | 50.2 /100 | #173 | Average 17.3% |
| Laotians | 50.0 /100 | #174 | Average 17.3% |
| Tsimshian | 49.8 /100 | #175 | Average 17.3% |
| Shoshone | 49.2 /100 | #176 | Average 17.3% |
| Ute | 49.1 /100 | #177 | Average 17.3% |
Demographics Similar to Puerto Ricans by Cognitive Disability
In terms of cognitive disability, the demographic groups most similar to Puerto Ricans are Cape Verdean (19.2%, a difference of 0.020%), Tohono O'odham (19.3%, a difference of 0.26%), Houma (19.3%, a difference of 0.26%), Lumbee (19.1%, a difference of 0.47%), and Immigrants from Saudi Arabia (19.1%, a difference of 0.82%).
| Demographics | Rating | Rank | Cognitive Disability |
| Immigrants | Sudan | 0.0 /100 | #332 | Tragic 18.8% |
| Immigrants | Yemen | 0.0 /100 | #333 | Tragic 18.8% |
| Sudanese | 0.0 /100 | #334 | Tragic 18.9% |
| Senegalese | 0.0 /100 | #335 | Tragic 19.0% |
| Blacks/African Americans | 0.0 /100 | #336 | Tragic 19.0% |
| Immigrants | Saudi Arabia | 0.0 /100 | #337 | Tragic 19.1% |
| Lumbee | 0.0 /100 | #338 | Tragic 19.1% |
| Puerto Ricans | 0.0 /100 | #339 | Tragic 19.2% |
| Cape Verdeans | 0.0 /100 | #340 | Tragic 19.2% |
| Tohono O'odham | 0.0 /100 | #341 | Tragic 19.3% |
| Houma | 0.0 /100 | #342 | Tragic 19.3% |
| Immigrants | Zaire | 0.0 /100 | #343 | Tragic 19.4% |
| Immigrants | Congo | 0.0 /100 | #344 | Tragic 19.7% |
| Somalis | 0.0 /100 | #345 | Tragic 19.8% |
| Immigrants | Cabo Verde | 0.0 /100 | #346 | Tragic 19.9% |