Ecuadorian vs Immigrants from Jamaica Cognitive Disability
COMPARE
Ecuadorian
Immigrants from Jamaica
Cognitive Disability
Cognitive Disability Comparison
Ecuadorians
Immigrants from Jamaica
17.2%
COGNITIVE DISABILITY
59.6/ 100
METRIC RATING
170th/ 347
METRIC RANK
17.6%
COGNITIVE DISABILITY
8.5/ 100
METRIC RATING
210th/ 347
METRIC RANK
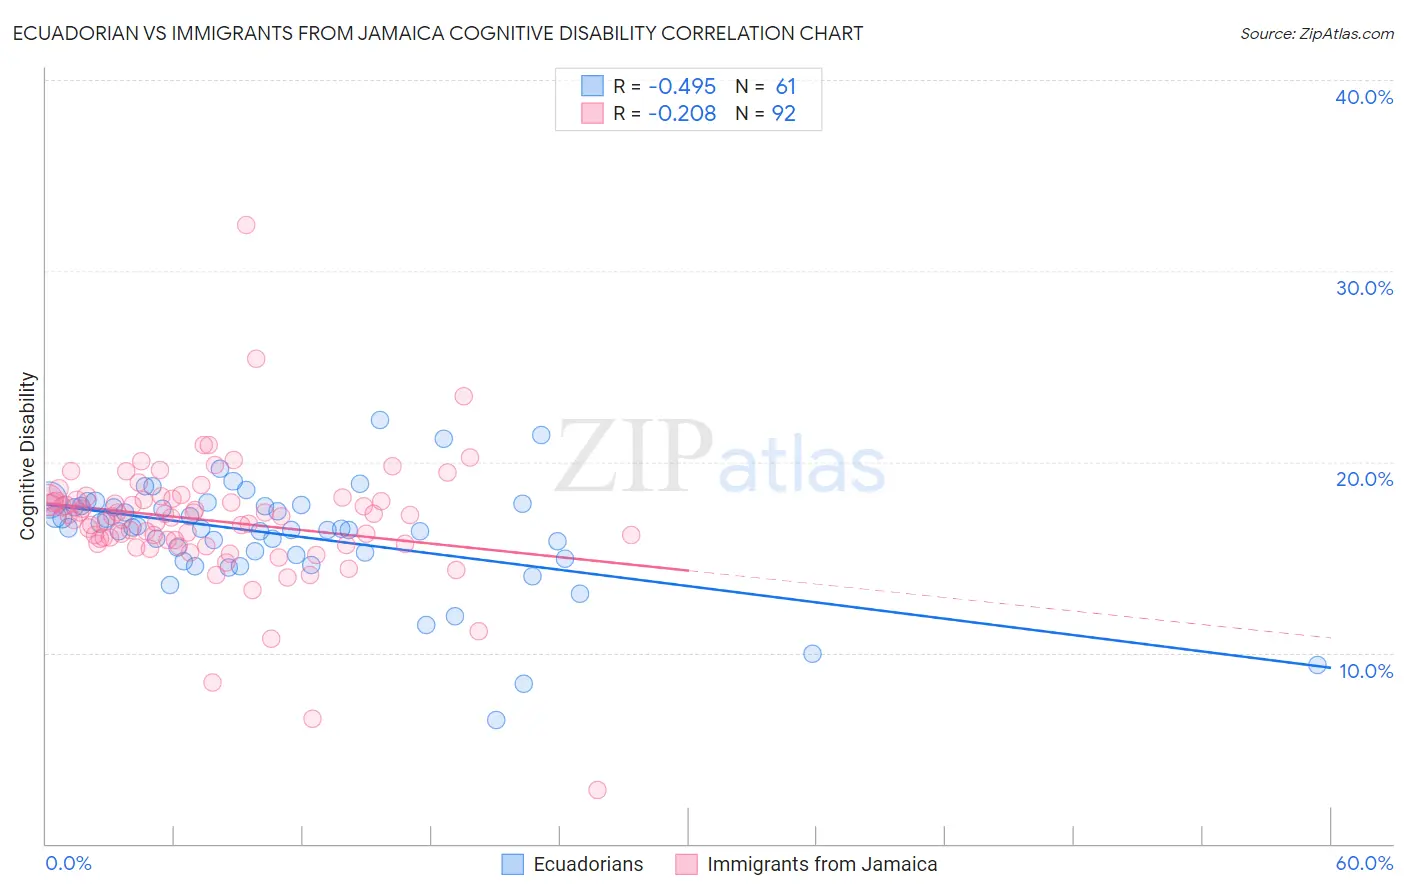
Ecuadorian vs Immigrants from Jamaica Cognitive Disability Correlation Chart
The statistical analysis conducted on geographies consisting of 317,812,387 people shows a moderate negative correlation between the proportion of Ecuadorians and percentage of population with cognitive disability in the United States with a correlation coefficient (R) of -0.495 and weighted average of 17.2%. Similarly, the statistical analysis conducted on geographies consisting of 301,744,234 people shows a weak negative correlation between the proportion of Immigrants from Jamaica and percentage of population with cognitive disability in the United States with a correlation coefficient (R) of -0.208 and weighted average of 17.6%, a difference of 2.0%.
Cognitive Disability Correlation Summary
| Measurement | Ecuadorian | Immigrants from Jamaica |
| Minimum | 6.5% | 2.8% |
| Maximum | 22.2% | 32.4% |
| Range | 15.7% | 29.6% |
| Mean | 16.2% | 16.9% |
| Median | 16.5% | 17.2% |
| Interquartile 25% (IQ1) | 15.0% | 15.8% |
| Interquartile 75% (IQ3) | 17.7% | 18.0% |
| Interquartile Range (IQR) | 2.7% | 2.2% |
| Standard Deviation (Sample) | 2.9% | 3.4% |
| Standard Deviation (Population) | 2.8% | 3.4% |
Similar Demographics by Cognitive Disability
Demographics Similar to Ecuadorians by Cognitive Disability
In terms of cognitive disability, the demographic groups most similar to Ecuadorians are Tlingit-Haida (17.2%, a difference of 0.0%), Immigrants from Portugal (17.2%, a difference of 0.070%), Immigrants (17.2%, a difference of 0.090%), Immigrants from Turkey (17.2%, a difference of 0.090%), and Immigrants from Syria (17.2%, a difference of 0.12%).
| Demographics | Rating | Rank | Cognitive Disability |
| Immigrants | Switzerland | 71.5 /100 | #163 | Good 17.2% |
| Armenians | 70.1 /100 | #164 | Good 17.2% |
| Immigrants | Albania | 64.9 /100 | #165 | Good 17.2% |
| Immigrants | Ecuador | 64.4 /100 | #166 | Good 17.2% |
| Immigrants | Syria | 63.5 /100 | #167 | Good 17.2% |
| Immigrants | Immigrants | 62.5 /100 | #168 | Good 17.2% |
| Immigrants | Portugal | 61.8 /100 | #169 | Good 17.2% |
| Ecuadorians | 59.6 /100 | #170 | Average 17.2% |
| Tlingit-Haida | 59.4 /100 | #171 | Average 17.2% |
| Immigrants | Turkey | 56.7 /100 | #172 | Average 17.2% |
| Immigrants | Northern Africa | 50.2 /100 | #173 | Average 17.3% |
| Laotians | 50.0 /100 | #174 | Average 17.3% |
| Tsimshian | 49.8 /100 | #175 | Average 17.3% |
| Shoshone | 49.2 /100 | #176 | Average 17.3% |
| Ute | 49.1 /100 | #177 | Average 17.3% |
Demographics Similar to Immigrants from Jamaica by Cognitive Disability
In terms of cognitive disability, the demographic groups most similar to Immigrants from Jamaica are Immigrants from Trinidad and Tobago (17.6%, a difference of 0.020%), Immigrants from Cameroon (17.6%, a difference of 0.070%), Taiwanese (17.6%, a difference of 0.070%), Immigrants from Latin America (17.6%, a difference of 0.10%), and Immigrants from Oceania (17.6%, a difference of 0.11%).
| Demographics | Rating | Rank | Cognitive Disability |
| Immigrants | Caribbean | 11.0 /100 | #203 | Poor 17.5% |
| Immigrants | Zimbabwe | 11.0 /100 | #204 | Poor 17.5% |
| Puget Sound Salish | 10.9 /100 | #205 | Poor 17.5% |
| Alaska Natives | 10.4 /100 | #206 | Poor 17.5% |
| Immigrants | Latin America | 9.7 /100 | #207 | Tragic 17.6% |
| Immigrants | Cameroon | 9.3 /100 | #208 | Tragic 17.6% |
| Immigrants | Trinidad and Tobago | 8.7 /100 | #209 | Tragic 17.6% |
| Immigrants | Jamaica | 8.5 /100 | #210 | Tragic 17.6% |
| Taiwanese | 7.7 /100 | #211 | Tragic 17.6% |
| Immigrants | Oceania | 7.3 /100 | #212 | Tragic 17.6% |
| Hawaiians | 7.2 /100 | #213 | Tragic 17.6% |
| Immigrants | El Salvador | 7.0 /100 | #214 | Tragic 17.6% |
| Alaskan Athabascans | 6.9 /100 | #215 | Tragic 17.6% |
| Okinawans | 6.8 /100 | #216 | Tragic 17.6% |
| Salvadorans | 6.7 /100 | #217 | Tragic 17.6% |