Immigrants from Ghana vs Puerto Rican Cognitive Disability
COMPARE
Immigrants from Ghana
Puerto Rican
Cognitive Disability
Cognitive Disability Comparison
Immigrants from Ghana
Puerto Ricans
18.3%
COGNITIVE DISABILITY
0.0/ 100
METRIC RATING
301st/ 347
METRIC RANK
19.2%
COGNITIVE DISABILITY
0.0/ 100
METRIC RATING
339th/ 347
METRIC RANK
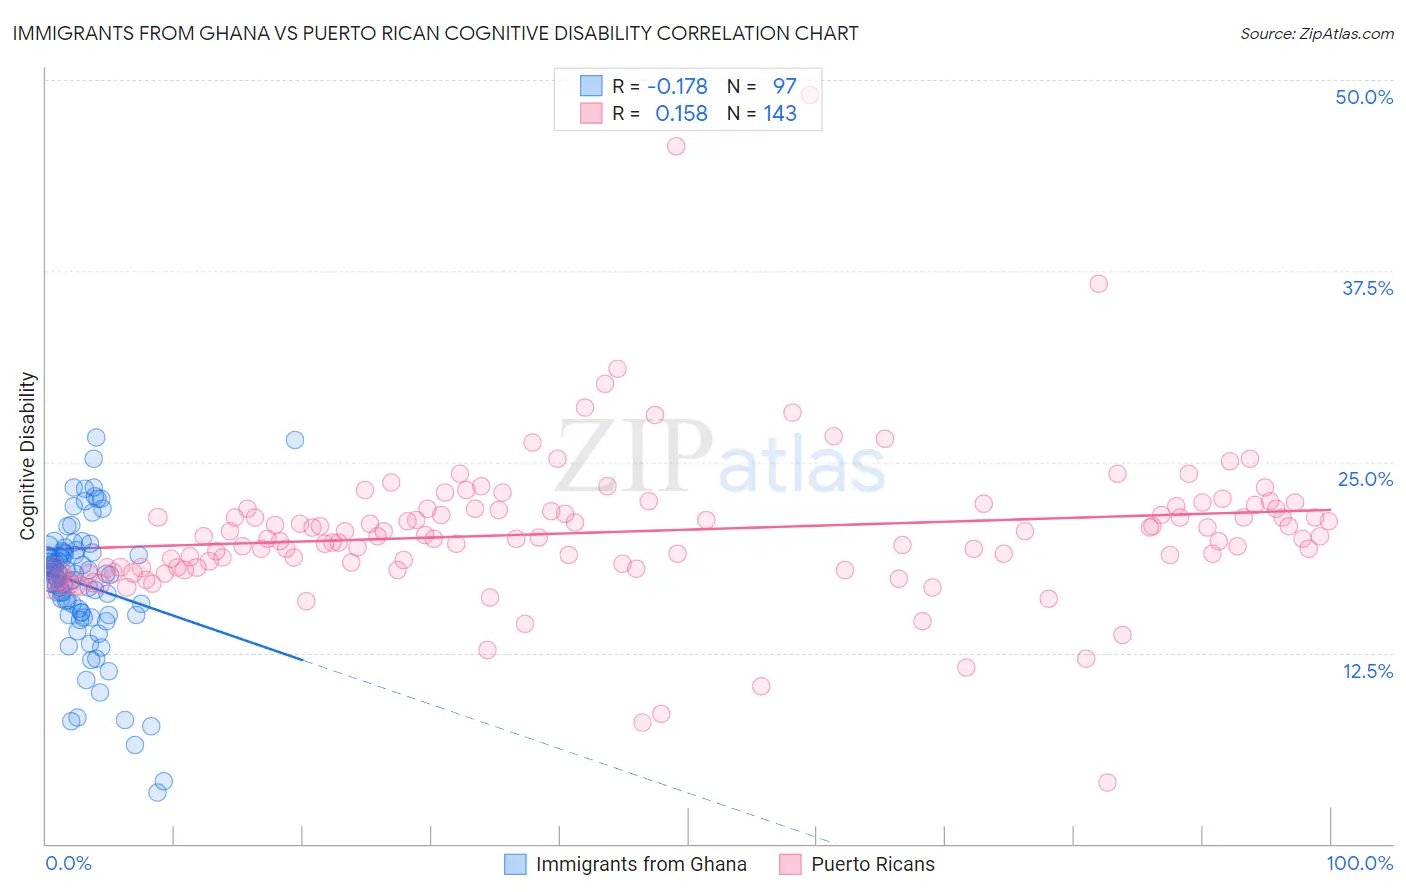
Immigrants from Ghana vs Puerto Rican Cognitive Disability Correlation Chart
The statistical analysis conducted on geographies consisting of 199,902,948 people shows a poor negative correlation between the proportion of Immigrants from Ghana and percentage of population with cognitive disability in the United States with a correlation coefficient (R) of -0.178 and weighted average of 18.3%. Similarly, the statistical analysis conducted on geographies consisting of 528,170,098 people shows a poor positive correlation between the proportion of Puerto Ricans and percentage of population with cognitive disability in the United States with a correlation coefficient (R) of 0.158 and weighted average of 19.2%, a difference of 5.0%.
Cognitive Disability Correlation Summary
| Measurement | Immigrants from Ghana | Puerto Rican |
| Minimum | 3.4% | 4.0% |
| Maximum | 26.6% | 49.0% |
| Range | 23.2% | 44.9% |
| Mean | 17.0% | 20.4% |
| Median | 17.6% | 20.1% |
| Interquartile 25% (IQ1) | 15.1% | 18.1% |
| Interquartile 75% (IQ3) | 19.1% | 21.9% |
| Interquartile Range (IQR) | 4.0% | 3.8% |
| Standard Deviation (Sample) | 4.3% | 5.2% |
| Standard Deviation (Population) | 4.3% | 5.1% |
Similar Demographics by Cognitive Disability
Demographics Similar to Immigrants from Ghana by Cognitive Disability
In terms of cognitive disability, the demographic groups most similar to Immigrants from Ghana are Barbadian (18.3%, a difference of 0.080%), Immigrants from Kenya (18.3%, a difference of 0.090%), Creek (18.3%, a difference of 0.14%), Immigrants from Eritrea (18.3%, a difference of 0.15%), and Ghanaian (18.3%, a difference of 0.17%).
| Demographics | Rating | Rank | Cognitive Disability |
| British West Indians | 0.1 /100 | #294 | Tragic 18.2% |
| German Russians | 0.0 /100 | #295 | Tragic 18.2% |
| Immigrants | Burma/Myanmar | 0.0 /100 | #296 | Tragic 18.2% |
| Blackfeet | 0.0 /100 | #297 | Tragic 18.3% |
| Japanese | 0.0 /100 | #298 | Tragic 18.3% |
| Ghanaians | 0.0 /100 | #299 | Tragic 18.3% |
| Creek | 0.0 /100 | #300 | Tragic 18.3% |
| Immigrants | Ghana | 0.0 /100 | #301 | Tragic 18.3% |
| Barbadians | 0.0 /100 | #302 | Tragic 18.3% |
| Immigrants | Kenya | 0.0 /100 | #303 | Tragic 18.3% |
| Immigrants | Eritrea | 0.0 /100 | #304 | Tragic 18.3% |
| Colville | 0.0 /100 | #305 | Tragic 18.3% |
| Seminole | 0.0 /100 | #306 | Tragic 18.3% |
| Ugandans | 0.0 /100 | #307 | Tragic 18.3% |
| Immigrants | Western Africa | 0.0 /100 | #308 | Tragic 18.4% |
Demographics Similar to Puerto Ricans by Cognitive Disability
In terms of cognitive disability, the demographic groups most similar to Puerto Ricans are Cape Verdean (19.2%, a difference of 0.020%), Tohono O'odham (19.3%, a difference of 0.26%), Houma (19.3%, a difference of 0.26%), Lumbee (19.1%, a difference of 0.47%), and Immigrants from Saudi Arabia (19.1%, a difference of 0.82%).
| Demographics | Rating | Rank | Cognitive Disability |
| Immigrants | Sudan | 0.0 /100 | #332 | Tragic 18.8% |
| Immigrants | Yemen | 0.0 /100 | #333 | Tragic 18.8% |
| Sudanese | 0.0 /100 | #334 | Tragic 18.9% |
| Senegalese | 0.0 /100 | #335 | Tragic 19.0% |
| Blacks/African Americans | 0.0 /100 | #336 | Tragic 19.0% |
| Immigrants | Saudi Arabia | 0.0 /100 | #337 | Tragic 19.1% |
| Lumbee | 0.0 /100 | #338 | Tragic 19.1% |
| Puerto Ricans | 0.0 /100 | #339 | Tragic 19.2% |
| Cape Verdeans | 0.0 /100 | #340 | Tragic 19.2% |
| Tohono O'odham | 0.0 /100 | #341 | Tragic 19.3% |
| Houma | 0.0 /100 | #342 | Tragic 19.3% |
| Immigrants | Zaire | 0.0 /100 | #343 | Tragic 19.4% |
| Immigrants | Congo | 0.0 /100 | #344 | Tragic 19.7% |
| Somalis | 0.0 /100 | #345 | Tragic 19.8% |
| Immigrants | Cabo Verde | 0.0 /100 | #346 | Tragic 19.9% |