Ecuadorian vs White/Caucasian Disability Age 18 to 34
COMPARE
Ecuadorian
White/Caucasian
Disability Age 18 to 34
Disability Age 18 to 34 Comparison
Ecuadorians
Whites/Caucasians
5.8%
DISABILITY AGE 18 TO 34
99.9/ 100
METRIC RATING
36th/ 347
METRIC RANK
7.6%
DISABILITY AGE 18 TO 34
0.0/ 100
METRIC RATING
288th/ 347
METRIC RANK
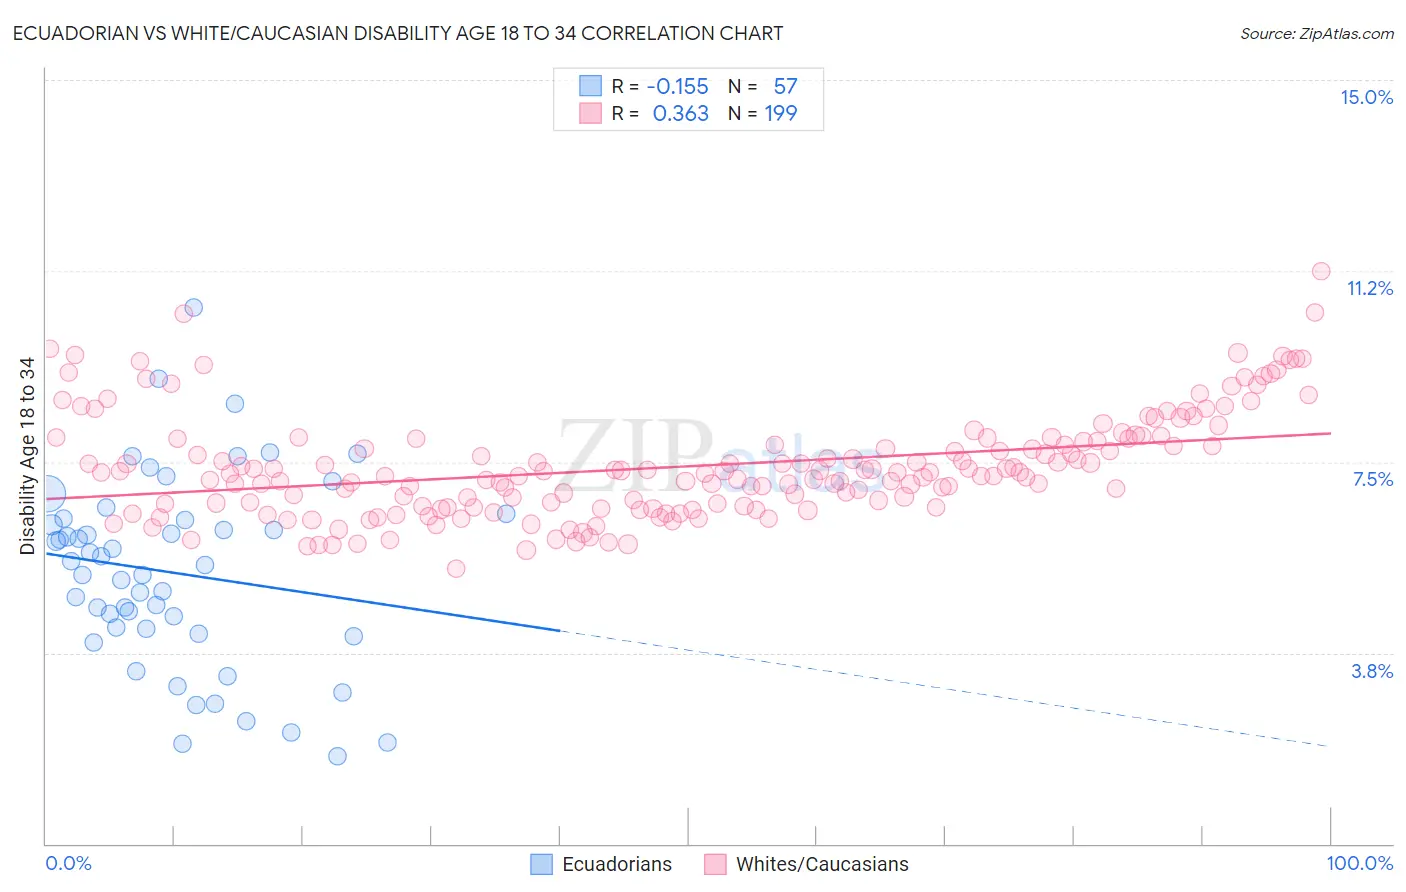
Ecuadorian vs White/Caucasian Disability Age 18 to 34 Correlation Chart
The statistical analysis conducted on geographies consisting of 317,415,300 people shows a poor negative correlation between the proportion of Ecuadorians and percentage of population with a disability between the ages 18 and 35 in the United States with a correlation coefficient (R) of -0.155 and weighted average of 5.8%. Similarly, the statistical analysis conducted on geographies consisting of 575,670,082 people shows a mild positive correlation between the proportion of Whites/Caucasians and percentage of population with a disability between the ages 18 and 35 in the United States with a correlation coefficient (R) of 0.363 and weighted average of 7.6%, a difference of 31.6%.
Disability Age 18 to 34 Correlation Summary
| Measurement | Ecuadorian | White/Caucasian |
| Minimum | 1.7% | 5.4% |
| Maximum | 10.5% | 11.2% |
| Range | 8.8% | 5.8% |
| Mean | 5.3% | 7.4% |
| Median | 5.5% | 7.3% |
| Interquartile 25% (IQ1) | 4.2% | 6.6% |
| Interquartile 75% (IQ3) | 6.4% | 8.0% |
| Interquartile Range (IQR) | 2.2% | 1.3% |
| Standard Deviation (Sample) | 1.9% | 1.0% |
| Standard Deviation (Population) | 1.9% | 1.0% |
Similar Demographics by Disability Age 18 to 34
Demographics Similar to Ecuadorians by Disability Age 18 to 34
In terms of disability age 18 to 34, the demographic groups most similar to Ecuadorians are Armenian (5.8%, a difference of 0.090%), Immigrants from South America (5.8%, a difference of 0.11%), Immigrants from Lithuania (5.8%, a difference of 0.15%), Venezuelan (5.8%, a difference of 0.38%), and Asian (5.8%, a difference of 0.42%).
| Demographics | Rating | Rank | Disability Age 18 to 34 |
| Immigrants | Ecuador | 99.9 /100 | #29 | Exceptional 5.7% |
| Immigrants | Pakistan | 99.9 /100 | #30 | Exceptional 5.8% |
| Iranians | 99.9 /100 | #31 | Exceptional 5.8% |
| Immigrants | Barbados | 99.9 /100 | #32 | Exceptional 5.8% |
| Argentineans | 99.9 /100 | #33 | Exceptional 5.8% |
| Venezuelans | 99.9 /100 | #34 | Exceptional 5.8% |
| Immigrants | Lithuania | 99.9 /100 | #35 | Exceptional 5.8% |
| Ecuadorians | 99.9 /100 | #36 | Exceptional 5.8% |
| Armenians | 99.9 /100 | #37 | Exceptional 5.8% |
| Immigrants | South America | 99.9 /100 | #38 | Exceptional 5.8% |
| Asians | 99.9 /100 | #39 | Exceptional 5.8% |
| Bolivians | 99.9 /100 | #40 | Exceptional 5.8% |
| Nicaraguans | 99.9 /100 | #41 | Exceptional 5.8% |
| Colombians | 99.8 /100 | #42 | Exceptional 5.9% |
| South Americans | 99.8 /100 | #43 | Exceptional 5.9% |
Demographics Similar to Whites/Caucasians by Disability Age 18 to 34
In terms of disability age 18 to 34, the demographic groups most similar to Whites/Caucasians are Norwegian (7.6%, a difference of 0.090%), Nonimmigrants (7.6%, a difference of 0.12%), Slovak (7.7%, a difference of 0.21%), Irish (7.7%, a difference of 0.26%), and Celtic (7.6%, a difference of 0.37%).
| Demographics | Rating | Rank | Disability Age 18 to 34 |
| Paiute | 0.0 /100 | #281 | Tragic 7.5% |
| Spanish | 0.0 /100 | #282 | Tragic 7.5% |
| Danes | 0.0 /100 | #283 | Tragic 7.5% |
| Hopi | 0.0 /100 | #284 | Tragic 7.5% |
| Swedes | 0.0 /100 | #285 | Tragic 7.5% |
| Celtics | 0.0 /100 | #286 | Tragic 7.6% |
| Norwegians | 0.0 /100 | #287 | Tragic 7.6% |
| Whites/Caucasians | 0.0 /100 | #288 | Tragic 7.6% |
| Immigrants | Nonimmigrants | 0.0 /100 | #289 | Tragic 7.6% |
| Slovaks | 0.0 /100 | #290 | Tragic 7.7% |
| Irish | 0.0 /100 | #291 | Tragic 7.7% |
| Blacks/African Americans | 0.0 /100 | #292 | Tragic 7.7% |
| Scandinavians | 0.0 /100 | #293 | Tragic 7.7% |
| Immigrants | Cabo Verde | 0.0 /100 | #294 | Tragic 7.7% |
| Tlingit-Haida | 0.0 /100 | #295 | Tragic 7.7% |