Dutch West Indian vs Belgian Disability Age 35 to 64
COMPARE
Dutch West Indian
Belgian
Disability Age 35 to 64
Disability Age 35 to 64 Comparison
Dutch West Indians
Belgians
15.6%
DISABILITY AGE 35 TO 64
0.0/ 100
METRIC RATING
331st/ 347
METRIC RANK
11.7%
DISABILITY AGE 35 TO 64
13.1/ 100
METRIC RATING
210th/ 347
METRIC RANK
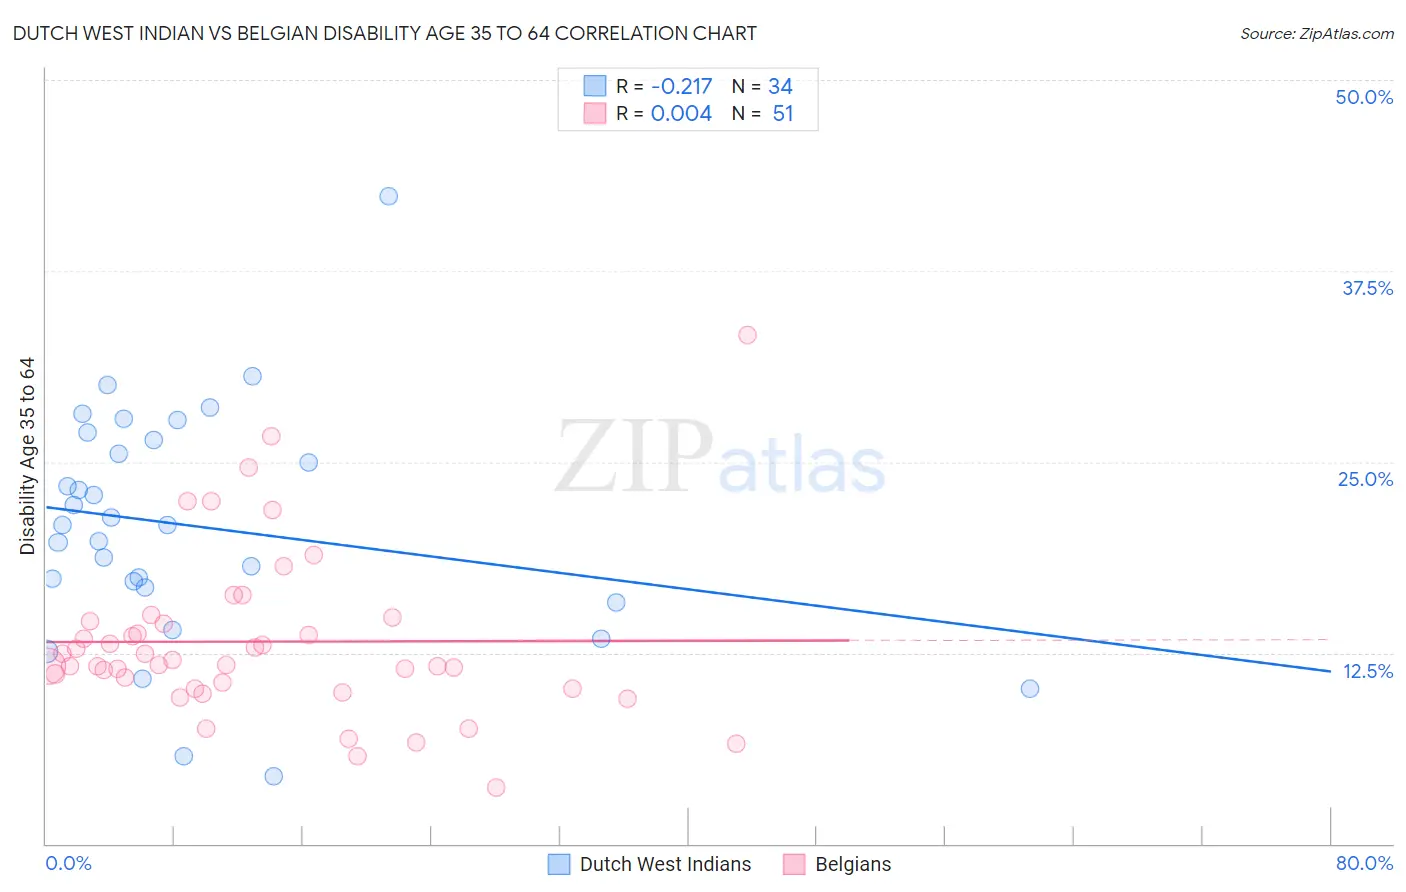
Dutch West Indian vs Belgian Disability Age 35 to 64 Correlation Chart
The statistical analysis conducted on geographies consisting of 85,764,745 people shows a weak negative correlation between the proportion of Dutch West Indians and percentage of population with a disability between the ages 34 and 64 in the United States with a correlation coefficient (R) of -0.217 and weighted average of 15.6%. Similarly, the statistical analysis conducted on geographies consisting of 355,809,909 people shows no correlation between the proportion of Belgians and percentage of population with a disability between the ages 34 and 64 in the United States with a correlation coefficient (R) of 0.004 and weighted average of 11.7%, a difference of 33.6%.
Disability Age 35 to 64 Correlation Summary
| Measurement | Dutch West Indian | Belgian |
| Minimum | 4.4% | 3.7% |
| Maximum | 42.4% | 33.3% |
| Range | 38.0% | 29.6% |
| Mean | 20.8% | 13.2% |
| Median | 20.9% | 11.7% |
| Interquartile 25% (IQ1) | 16.8% | 10.2% |
| Interquartile 75% (IQ3) | 26.5% | 14.6% |
| Interquartile Range (IQR) | 9.7% | 4.4% |
| Standard Deviation (Sample) | 7.7% | 5.5% |
| Standard Deviation (Population) | 7.6% | 5.4% |
Similar Demographics by Disability Age 35 to 64
Demographics Similar to Dutch West Indians by Disability Age 35 to 64
In terms of disability age 35 to 64, the demographic groups most similar to Dutch West Indians are Alaskan Athabascan (15.7%, a difference of 0.59%), Navajo (15.5%, a difference of 0.92%), Cherokee (15.5%, a difference of 1.1%), Yuman (15.8%, a difference of 1.1%), and Colville (15.8%, a difference of 1.3%).
| Demographics | Rating | Rank | Disability Age 35 to 64 |
| Chippewa | 0.0 /100 | #324 | Tragic 15.0% |
| Arapaho | 0.0 /100 | #325 | Tragic 15.1% |
| Natives/Alaskans | 0.0 /100 | #326 | Tragic 15.3% |
| Pueblo | 0.0 /100 | #327 | Tragic 15.3% |
| Cajuns | 0.0 /100 | #328 | Tragic 15.3% |
| Cherokee | 0.0 /100 | #329 | Tragic 15.5% |
| Navajo | 0.0 /100 | #330 | Tragic 15.5% |
| Dutch West Indians | 0.0 /100 | #331 | Tragic 15.6% |
| Alaskan Athabascans | 0.0 /100 | #332 | Tragic 15.7% |
| Yuman | 0.0 /100 | #333 | Tragic 15.8% |
| Colville | 0.0 /100 | #334 | Tragic 15.8% |
| Seminole | 0.0 /100 | #335 | Tragic 15.9% |
| Menominee | 0.0 /100 | #336 | Tragic 15.9% |
| Puerto Ricans | 0.0 /100 | #337 | Tragic 15.9% |
| Chickasaw | 0.0 /100 | #338 | Tragic 16.1% |
Demographics Similar to Belgians by Disability Age 35 to 64
In terms of disability age 35 to 64, the demographic groups most similar to Belgians are Canadian (11.7%, a difference of 0.010%), European (11.7%, a difference of 0.070%), Immigrants from Jamaica (11.7%, a difference of 0.23%), Guatemalan (11.7%, a difference of 0.26%), and Yugoslavian (11.7%, a difference of 0.26%).
| Demographics | Rating | Rank | Disability Age 35 to 64 |
| British | 17.0 /100 | #203 | Poor 11.6% |
| Nigerians | 16.3 /100 | #204 | Poor 11.6% |
| Slavs | 15.5 /100 | #205 | Poor 11.7% |
| Native Hawaiians | 14.8 /100 | #206 | Poor 11.7% |
| Ghanaians | 14.8 /100 | #207 | Poor 11.7% |
| Guatemalans | 14.6 /100 | #208 | Poor 11.7% |
| Europeans | 13.5 /100 | #209 | Poor 11.7% |
| Belgians | 13.1 /100 | #210 | Poor 11.7% |
| Canadians | 13.0 /100 | #211 | Poor 11.7% |
| Immigrants | Jamaica | 11.8 /100 | #212 | Poor 11.7% |
| Yugoslavians | 11.6 /100 | #213 | Poor 11.7% |
| Immigrants | Sudan | 11.4 /100 | #214 | Poor 11.7% |
| Spanish American Indians | 11.1 /100 | #215 | Poor 11.7% |
| Bahamians | 10.7 /100 | #216 | Poor 11.8% |
| Barbadians | 9.5 /100 | #217 | Tragic 11.8% |