Dutch vs Iranian Male Disability
COMPARE
Dutch
Iranian
Male Disability
Male Disability Comparison
Dutch
Iranians
12.7%
MALE DISABILITY
0.0/ 100
METRIC RATING
280th/ 347
METRIC RANK
9.7%
MALE DISABILITY
100.0/ 100
METRIC RATING
13th/ 347
METRIC RANK
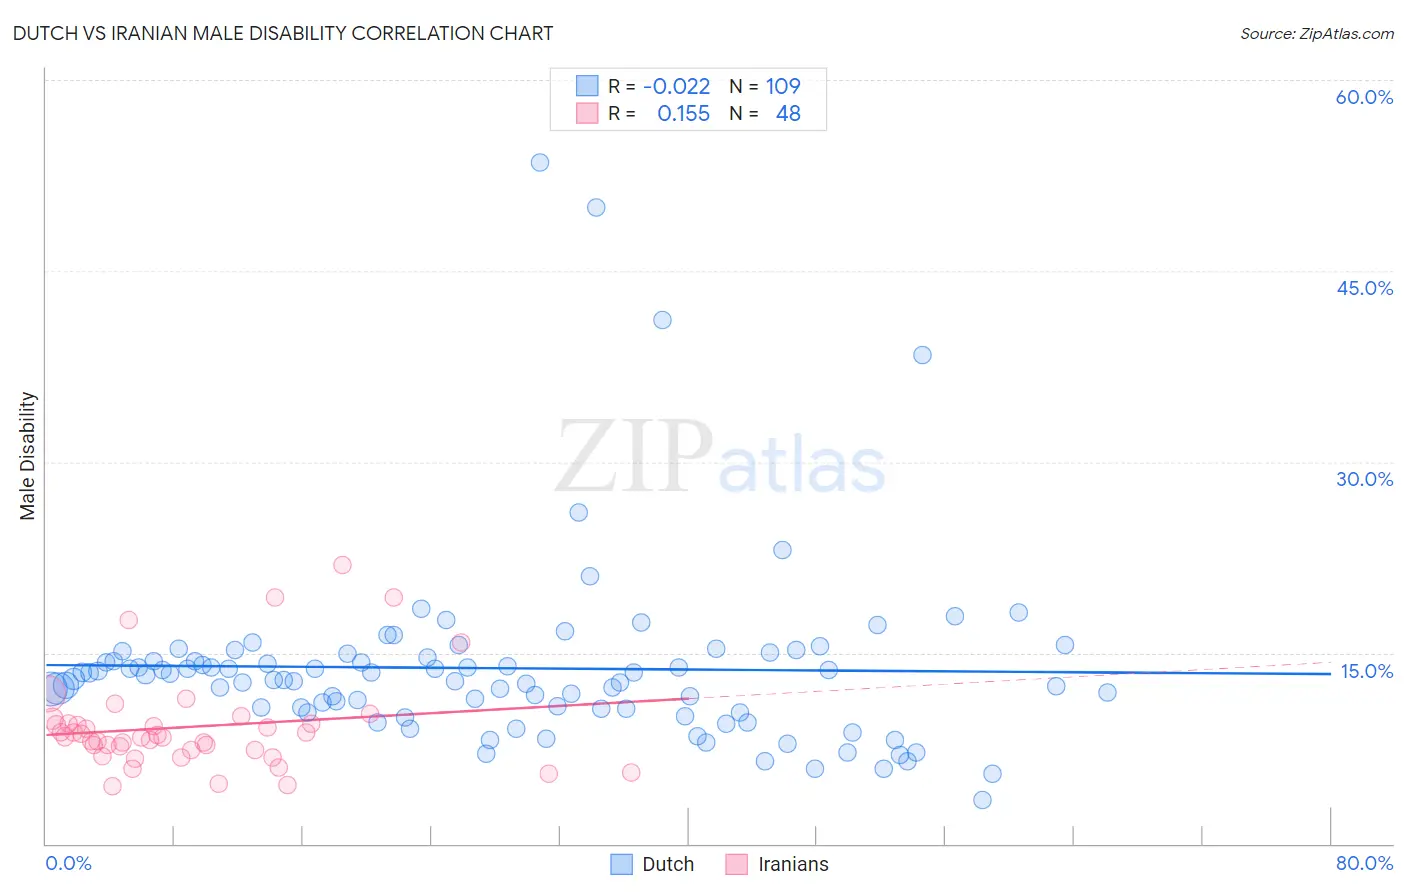
Dutch vs Iranian Male Disability Correlation Chart
The statistical analysis conducted on geographies consisting of 554,174,646 people shows no correlation between the proportion of Dutch and percentage of males with a disability in the United States with a correlation coefficient (R) of -0.022 and weighted average of 12.7%. Similarly, the statistical analysis conducted on geographies consisting of 316,851,194 people shows a poor positive correlation between the proportion of Iranians and percentage of males with a disability in the United States with a correlation coefficient (R) of 0.155 and weighted average of 9.7%, a difference of 31.4%.
Male Disability Correlation Summary
| Measurement | Dutch | Iranian |
| Minimum | 3.4% | 4.5% |
| Maximum | 53.5% | 21.9% |
| Range | 50.1% | 17.4% |
| Mean | 13.8% | 9.2% |
| Median | 13.0% | 8.4% |
| Interquartile 25% (IQ1) | 10.6% | 7.4% |
| Interquartile 75% (IQ3) | 14.8% | 9.4% |
| Interquartile Range (IQR) | 4.2% | 2.1% |
| Standard Deviation (Sample) | 7.3% | 3.7% |
| Standard Deviation (Population) | 7.3% | 3.7% |
Similar Demographics by Male Disability
Demographics Similar to Dutch by Male Disability
In terms of male disability, the demographic groups most similar to Dutch are Slovak (12.7%, a difference of 0.050%), Sioux (12.7%, a difference of 0.060%), Irish (12.7%, a difference of 0.11%), German (12.7%, a difference of 0.12%), and Central American Indian (12.7%, a difference of 0.20%).
| Demographics | Rating | Rank | Male Disability |
| Native Hawaiians | 0.0 /100 | #273 | Tragic 12.5% |
| Hopi | 0.0 /100 | #274 | Tragic 12.5% |
| Fijians | 0.0 /100 | #275 | Tragic 12.6% |
| Africans | 0.0 /100 | #276 | Tragic 12.6% |
| Finns | 0.0 /100 | #277 | Tragic 12.6% |
| Central American Indians | 0.0 /100 | #278 | Tragic 12.7% |
| Slovaks | 0.0 /100 | #279 | Tragic 12.7% |
| Dutch | 0.0 /100 | #280 | Tragic 12.7% |
| Sioux | 0.0 /100 | #281 | Tragic 12.7% |
| Irish | 0.0 /100 | #282 | Tragic 12.7% |
| Germans | 0.0 /100 | #283 | Tragic 12.7% |
| Spanish | 0.0 /100 | #284 | Tragic 12.7% |
| Welsh | 0.0 /100 | #285 | Tragic 12.7% |
| Scottish | 0.0 /100 | #286 | Tragic 12.8% |
| Cape Verdeans | 0.0 /100 | #287 | Tragic 12.8% |
Demographics Similar to Iranians by Male Disability
In terms of male disability, the demographic groups most similar to Iranians are Immigrants from Iran (9.7%, a difference of 0.10%), Bolivian (9.6%, a difference of 0.23%), Immigrants from Eastern Asia (9.6%, a difference of 0.46%), Indian (Asian) (9.7%, a difference of 0.55%), and Immigrants from Israel (9.6%, a difference of 1.0%).
| Demographics | Rating | Rank | Male Disability |
| Immigrants | South Central Asia | 100.0 /100 | #6 | Exceptional 9.4% |
| Immigrants | Bolivia | 100.0 /100 | #7 | Exceptional 9.5% |
| Immigrants | China | 100.0 /100 | #8 | Exceptional 9.5% |
| Immigrants | Singapore | 100.0 /100 | #9 | Exceptional 9.5% |
| Immigrants | Israel | 100.0 /100 | #10 | Exceptional 9.6% |
| Immigrants | Eastern Asia | 100.0 /100 | #11 | Exceptional 9.6% |
| Bolivians | 100.0 /100 | #12 | Exceptional 9.6% |
| Iranians | 100.0 /100 | #13 | Exceptional 9.7% |
| Immigrants | Iran | 100.0 /100 | #14 | Exceptional 9.7% |
| Indians (Asian) | 100.0 /100 | #15 | Exceptional 9.7% |
| Okinawans | 100.0 /100 | #16 | Exceptional 9.8% |
| Immigrants | Korea | 100.0 /100 | #17 | Exceptional 9.8% |
| Immigrants | Pakistan | 100.0 /100 | #18 | Exceptional 9.8% |
| Immigrants | Sri Lanka | 100.0 /100 | #19 | Exceptional 10.0% |
| Asians | 100.0 /100 | #20 | Exceptional 10.0% |