Czech vs Bolivian Disability
COMPARE
Czech
Bolivian
Disability
Disability Comparison
Czechs
Bolivians
12.0%
DISABILITY
7.9/ 100
METRIC RATING
210th/ 347
METRIC RANK
10.0%
DISABILITY
100.0/ 100
METRIC RATING
8th/ 347
METRIC RANK
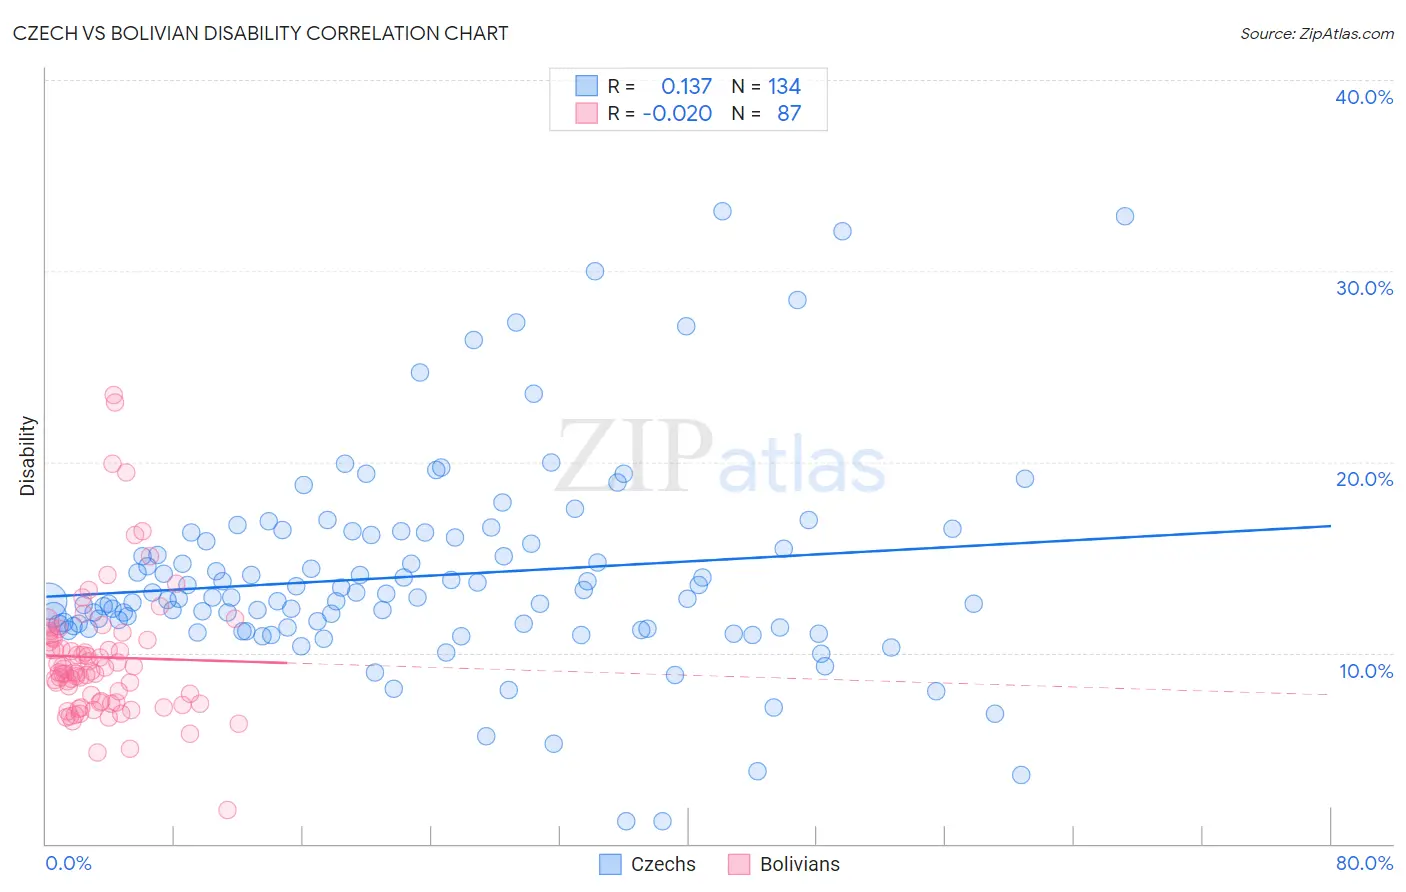
Czech vs Bolivian Disability Correlation Chart
The statistical analysis conducted on geographies consisting of 484,761,061 people shows a poor positive correlation between the proportion of Czechs and percentage of population with a disability in the United States with a correlation coefficient (R) of 0.137 and weighted average of 12.0%. Similarly, the statistical analysis conducted on geographies consisting of 184,660,652 people shows no correlation between the proportion of Bolivians and percentage of population with a disability in the United States with a correlation coefficient (R) of -0.020 and weighted average of 10.0%, a difference of 20.2%.
Disability Correlation Summary
| Measurement | Czech | Bolivian |
| Minimum | 1.2% | 1.7% |
| Maximum | 33.1% | 23.5% |
| Range | 31.9% | 21.8% |
| Mean | 14.0% | 9.8% |
| Median | 12.9% | 9.1% |
| Interquartile 25% (IQ1) | 11.3% | 7.4% |
| Interquartile 75% (IQ3) | 16.0% | 10.8% |
| Interquartile Range (IQR) | 4.7% | 3.4% |
| Standard Deviation (Sample) | 5.4% | 3.6% |
| Standard Deviation (Population) | 5.4% | 3.5% |
Similar Demographics by Disability
Demographics Similar to Czechs by Disability
In terms of disability, the demographic groups most similar to Czechs are Immigrants from Cambodia (12.0%, a difference of 0.080%), Austrian (12.0%, a difference of 0.11%), Immigrants from Iraq (12.0%, a difference of 0.11%), Danish (12.0%, a difference of 0.13%), and Immigrants from Somalia (12.0%, a difference of 0.16%).
| Demographics | Rating | Rank | Disability |
| British West Indians | 11.5 /100 | #203 | Poor 12.0% |
| Mexican American Indians | 11.4 /100 | #204 | Poor 12.0% |
| Immigrants | Western Europe | 10.1 /100 | #205 | Poor 12.0% |
| Immigrants | Senegal | 9.4 /100 | #206 | Tragic 12.0% |
| Immigrants | Thailand | 9.3 /100 | #207 | Tragic 12.0% |
| Immigrants | Caribbean | 9.1 /100 | #208 | Tragic 12.0% |
| Danes | 8.7 /100 | #209 | Tragic 12.0% |
| Czechs | 7.9 /100 | #210 | Tragic 12.0% |
| Immigrants | Cambodia | 7.3 /100 | #211 | Tragic 12.0% |
| Austrians | 7.2 /100 | #212 | Tragic 12.0% |
| Immigrants | Iraq | 7.1 /100 | #213 | Tragic 12.0% |
| Immigrants | Somalia | 6.8 /100 | #214 | Tragic 12.0% |
| Immigrants | Canada | 6.1 /100 | #215 | Tragic 12.1% |
| Panamanians | 5.4 /100 | #216 | Tragic 12.1% |
| Immigrants | North America | 5.3 /100 | #217 | Tragic 12.1% |
Demographics Similar to Bolivians by Disability
In terms of disability, the demographic groups most similar to Bolivians are Immigrants from Singapore (10.0%, a difference of 0.23%), Immigrants from Hong Kong (10.0%, a difference of 0.30%), Immigrants from South Central Asia (9.9%, a difference of 0.54%), Immigrants from China (10.1%, a difference of 1.1%), and Iranian (10.1%, a difference of 1.1%).
| Demographics | Rating | Rank | Disability |
| Immigrants | India | 100.0 /100 | #1 | Exceptional 9.5% |
| Filipinos | 100.0 /100 | #2 | Exceptional 9.6% |
| Immigrants | Taiwan | 100.0 /100 | #3 | Exceptional 9.6% |
| Thais | 100.0 /100 | #4 | Exceptional 9.7% |
| Immigrants | Bolivia | 100.0 /100 | #5 | Exceptional 9.9% |
| Immigrants | South Central Asia | 100.0 /100 | #6 | Exceptional 9.9% |
| Immigrants | Singapore | 100.0 /100 | #7 | Exceptional 10.0% |
| Bolivians | 100.0 /100 | #8 | Exceptional 10.0% |
| Immigrants | Hong Kong | 100.0 /100 | #9 | Exceptional 10.0% |
| Immigrants | China | 100.0 /100 | #10 | Exceptional 10.1% |
| Iranians | 100.0 /100 | #11 | Exceptional 10.1% |
| Immigrants | Israel | 100.0 /100 | #12 | Exceptional 10.1% |
| Immigrants | Eastern Asia | 100.0 /100 | #13 | Exceptional 10.2% |
| Immigrants | Korea | 100.0 /100 | #14 | Exceptional 10.2% |
| Okinawans | 100.0 /100 | #15 | Exceptional 10.3% |