Greek vs Ute Disability Age Over 75
COMPARE
Greek
Ute
Disability Age Over 75
Disability Age Over 75 Comparison
Greeks
Ute
45.6%
DISABILITY AGE OVER 75
99.8/ 100
METRIC RATING
42nd/ 347
METRIC RANK
52.6%
DISABILITY AGE OVER 75
0.0/ 100
METRIC RATING
326th/ 347
METRIC RANK
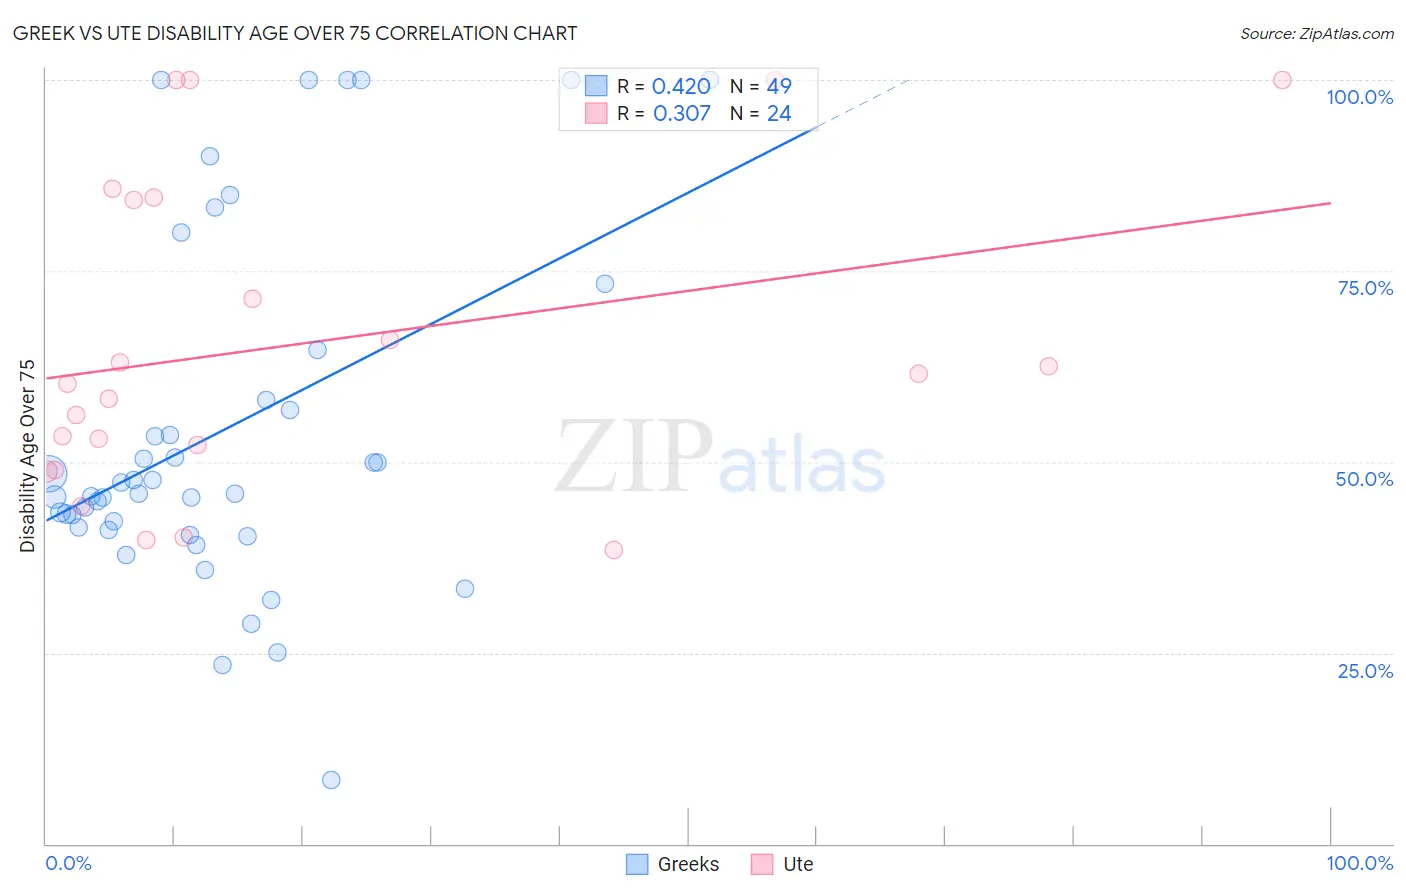
Greek vs Ute Disability Age Over 75 Correlation Chart
The statistical analysis conducted on geographies consisting of 481,666,477 people shows a moderate positive correlation between the proportion of Greeks and percentage of population with a disability over the age of 75 in the United States with a correlation coefficient (R) of 0.420 and weighted average of 45.6%. Similarly, the statistical analysis conducted on geographies consisting of 55,664,010 people shows a mild positive correlation between the proportion of Ute and percentage of population with a disability over the age of 75 in the United States with a correlation coefficient (R) of 0.307 and weighted average of 52.6%, a difference of 15.2%.
Disability Age Over 75 Correlation Summary
| Measurement | Greek | Ute |
| Minimum | 8.3% | 38.5% |
| Maximum | 100.0% | 100.0% |
| Range | 91.7% | 61.5% |
| Mean | 54.1% | 65.5% |
| Median | 45.8% | 60.9% |
| Interquartile 25% (IQ1) | 41.2% | 50.6% |
| Interquartile 75% (IQ3) | 61.4% | 84.4% |
| Interquartile Range (IQR) | 20.2% | 33.9% |
| Standard Deviation (Sample) | 22.9% | 20.5% |
| Standard Deviation (Population) | 22.7% | 20.1% |
Similar Demographics by Disability Age Over 75
Demographics Similar to Greeks by Disability Age Over 75
In terms of disability age over 75, the demographic groups most similar to Greeks are Czech (45.7%, a difference of 0.0%), Immigrants from Singapore (45.6%, a difference of 0.040%), Australian (45.7%, a difference of 0.040%), Turkish (45.7%, a difference of 0.040%), and Swedish (45.7%, a difference of 0.070%).
| Demographics | Rating | Rank | Disability Age Over 75 |
| Norwegians | 99.9 /100 | #35 | Exceptional 45.5% |
| Immigrants | Taiwan | 99.9 /100 | #36 | Exceptional 45.5% |
| South Africans | 99.9 /100 | #37 | Exceptional 45.5% |
| Italians | 99.9 /100 | #38 | Exceptional 45.6% |
| Estonians | 99.9 /100 | #39 | Exceptional 45.6% |
| Slovenes | 99.9 /100 | #40 | Exceptional 45.6% |
| Immigrants | Singapore | 99.8 /100 | #41 | Exceptional 45.6% |
| Greeks | 99.8 /100 | #42 | Exceptional 45.6% |
| Czechs | 99.8 /100 | #43 | Exceptional 45.7% |
| Australians | 99.8 /100 | #44 | Exceptional 45.7% |
| Turks | 99.8 /100 | #45 | Exceptional 45.7% |
| Swedes | 99.8 /100 | #46 | Exceptional 45.7% |
| Immigrants | Canada | 99.8 /100 | #47 | Exceptional 45.7% |
| Croatians | 99.8 /100 | #48 | Exceptional 45.7% |
| Immigrants | North America | 99.8 /100 | #49 | Exceptional 45.7% |
Demographics Similar to Ute by Disability Age Over 75
In terms of disability age over 75, the demographic groups most similar to Ute are Nepalese (52.6%, a difference of 0.030%), Choctaw (52.7%, a difference of 0.22%), Immigrants from Cabo Verde (52.4%, a difference of 0.35%), Alaska Native (52.8%, a difference of 0.44%), and Menominee (52.3%, a difference of 0.51%).
| Demographics | Rating | Rank | Disability Age Over 75 |
| Creek | 0.0 /100 | #319 | Tragic 51.5% |
| Paiute | 0.0 /100 | #320 | Tragic 51.5% |
| Dutch West Indians | 0.0 /100 | #321 | Tragic 51.5% |
| Comanche | 0.0 /100 | #322 | Tragic 51.7% |
| Immigrants | Yemen | 0.0 /100 | #323 | Tragic 52.0% |
| Menominee | 0.0 /100 | #324 | Tragic 52.3% |
| Immigrants | Cabo Verde | 0.0 /100 | #325 | Tragic 52.4% |
| Ute | 0.0 /100 | #326 | Tragic 52.6% |
| Nepalese | 0.0 /100 | #327 | Tragic 52.6% |
| Choctaw | 0.0 /100 | #328 | Tragic 52.7% |
| Alaska Natives | 0.0 /100 | #329 | Tragic 52.8% |
| Puerto Ricans | 0.0 /100 | #330 | Tragic 52.9% |
| Hopi | 0.0 /100 | #331 | Tragic 52.9% |
| Natives/Alaskans | 0.0 /100 | #332 | Tragic 53.1% |
| Apache | 0.0 /100 | #333 | Tragic 53.6% |