Cuban vs Immigrants from Ghana Disability Age 18 to 34
COMPARE
Cuban
Immigrants from Ghana
Disability Age 18 to 34
Disability Age 18 to 34 Comparison
Cubans
Immigrants from Ghana
5.7%
DISABILITY AGE 18 TO 34
100.0/ 100
METRIC RATING
23rd/ 347
METRIC RANK
6.6%
DISABILITY AGE 18 TO 34
42.1/ 100
METRIC RATING
179th/ 347
METRIC RANK
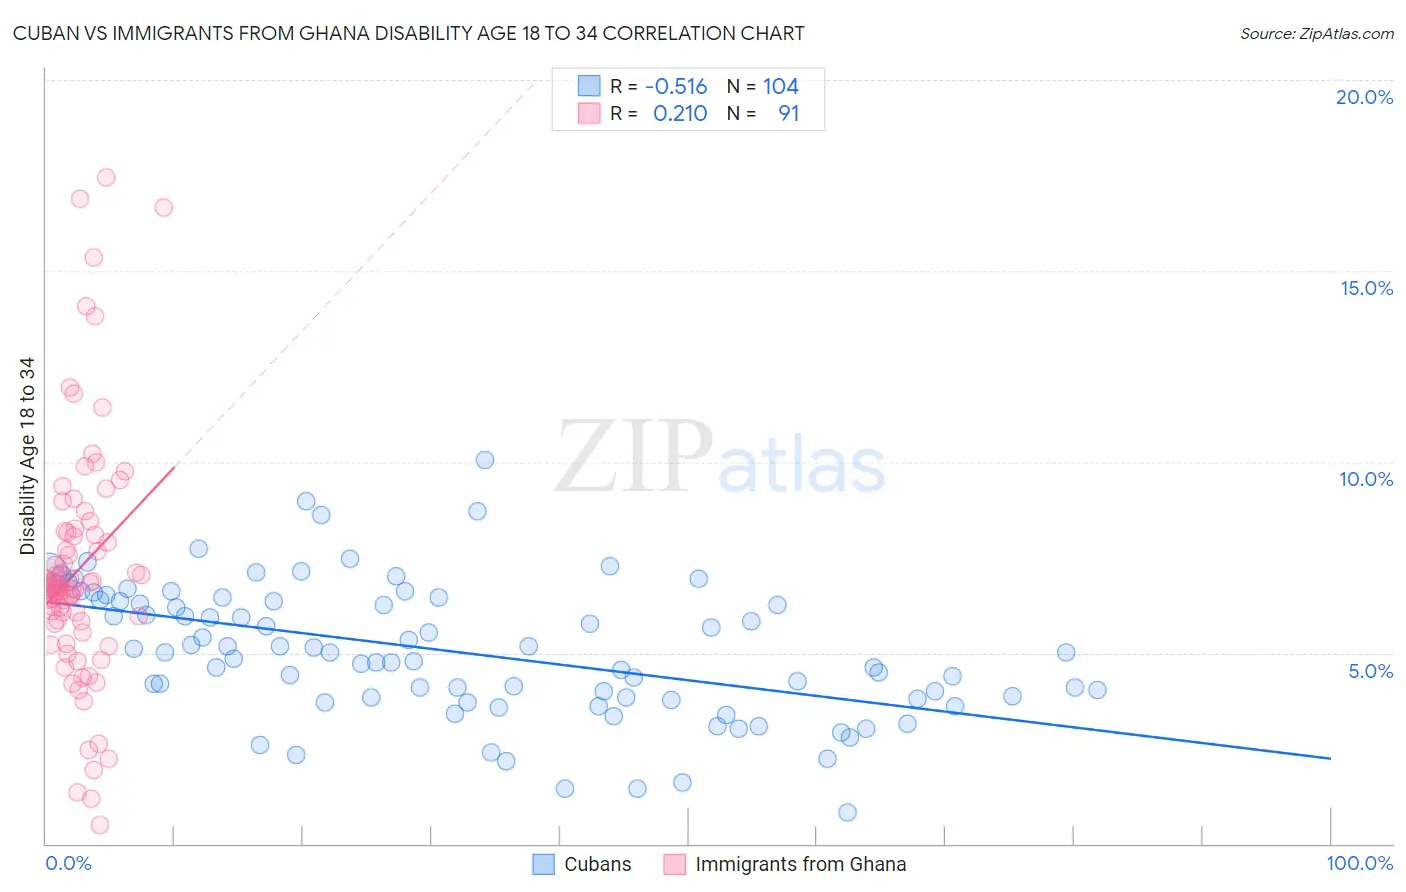
Cuban vs Immigrants from Ghana Disability Age 18 to 34 Correlation Chart
The statistical analysis conducted on geographies consisting of 448,003,598 people shows a substantial negative correlation between the proportion of Cubans and percentage of population with a disability between the ages 18 and 35 in the United States with a correlation coefficient (R) of -0.516 and weighted average of 5.7%. Similarly, the statistical analysis conducted on geographies consisting of 199,825,304 people shows a weak positive correlation between the proportion of Immigrants from Ghana and percentage of population with a disability between the ages 18 and 35 in the United States with a correlation coefficient (R) of 0.210 and weighted average of 6.6%, a difference of 16.3%.
Disability Age 18 to 34 Correlation Summary
| Measurement | Cuban | Immigrants from Ghana |
| Minimum | 0.83% | 0.50% |
| Maximum | 10.1% | 17.4% |
| Range | 9.2% | 16.9% |
| Mean | 5.0% | 7.2% |
| Median | 5.0% | 6.7% |
| Interquartile 25% (IQ1) | 3.8% | 5.8% |
| Interquartile 75% (IQ3) | 6.4% | 8.2% |
| Interquartile Range (IQR) | 2.6% | 2.3% |
| Standard Deviation (Sample) | 1.8% | 3.2% |
| Standard Deviation (Population) | 1.8% | 3.1% |
Similar Demographics by Disability Age 18 to 34
Demographics Similar to Cubans by Disability Age 18 to 34
In terms of disability age 18 to 34, the demographic groups most similar to Cubans are Immigrants from Argentina (5.7%, a difference of 0.10%), Immigrants from Singapore (5.7%, a difference of 0.14%), Immigrants from Colombia (5.7%, a difference of 0.29%), Immigrants from Venezuela (5.7%, a difference of 0.40%), and Soviet Union (5.7%, a difference of 0.49%).
| Demographics | Rating | Rank | Disability Age 18 to 34 |
| Immigrants | Israel | 100.0 /100 | #16 | Exceptional 5.6% |
| Immigrants | Eastern Asia | 100.0 /100 | #17 | Exceptional 5.6% |
| Immigrants | Bolivia | 100.0 /100 | #18 | Exceptional 5.6% |
| Thais | 100.0 /100 | #19 | Exceptional 5.6% |
| Immigrants | Bangladesh | 100.0 /100 | #20 | Exceptional 5.6% |
| Immigrants | South Central Asia | 100.0 /100 | #21 | Exceptional 5.7% |
| Immigrants | Nicaragua | 100.0 /100 | #22 | Exceptional 5.7% |
| Cubans | 100.0 /100 | #23 | Exceptional 5.7% |
| Immigrants | Argentina | 100.0 /100 | #24 | Exceptional 5.7% |
| Immigrants | Singapore | 100.0 /100 | #25 | Exceptional 5.7% |
| Immigrants | Colombia | 100.0 /100 | #26 | Exceptional 5.7% |
| Immigrants | Venezuela | 99.9 /100 | #27 | Exceptional 5.7% |
| Soviet Union | 99.9 /100 | #28 | Exceptional 5.7% |
| Immigrants | Ecuador | 99.9 /100 | #29 | Exceptional 5.7% |
| Immigrants | Pakistan | 99.9 /100 | #30 | Exceptional 5.8% |
Demographics Similar to Immigrants from Ghana by Disability Age 18 to 34
In terms of disability age 18 to 34, the demographic groups most similar to Immigrants from Ghana are Nigerian (6.6%, a difference of 0.11%), Syrian (6.6%, a difference of 0.15%), Immigrants from Austria (6.6%, a difference of 0.18%), Romanian (6.6%, a difference of 0.19%), and U.S. Virgin Islander (6.7%, a difference of 0.25%).
| Demographics | Rating | Rank | Disability Age 18 to 34 |
| Ghanaians | 54.7 /100 | #172 | Average 6.6% |
| Immigrants | Mexico | 54.1 /100 | #173 | Average 6.6% |
| Native Hawaiians | 50.0 /100 | #174 | Average 6.6% |
| Immigrants | Cambodia | 46.5 /100 | #175 | Average 6.6% |
| Immigrants | Africa | 45.9 /100 | #176 | Average 6.6% |
| Syrians | 44.3 /100 | #177 | Average 6.6% |
| Nigerians | 43.7 /100 | #178 | Average 6.6% |
| Immigrants | Ghana | 42.1 /100 | #179 | Average 6.6% |
| Immigrants | Austria | 39.6 /100 | #180 | Fair 6.6% |
| Romanians | 39.5 /100 | #181 | Fair 6.6% |
| U.S. Virgin Islanders | 38.6 /100 | #182 | Fair 6.7% |
| Immigrants | Iraq | 37.4 /100 | #183 | Fair 6.7% |
| Iraqis | 37.4 /100 | #184 | Fair 6.7% |
| Immigrants | Oceania | 35.4 /100 | #185 | Fair 6.7% |
| Yup'ik | 35.3 /100 | #186 | Fair 6.7% |