Croatian vs Immigrants from Uzbekistan Disability Age 35 to 64
COMPARE
Croatian
Immigrants from Uzbekistan
Disability Age 35 to 64
Disability Age 35 to 64 Comparison
Croatians
Immigrants from Uzbekistan
11.0%
DISABILITY AGE 35 TO 64
73.1/ 100
METRIC RATING
160th/ 347
METRIC RANK
10.1%
DISABILITY AGE 35 TO 64
99.5/ 100
METRIC RATING
67th/ 347
METRIC RANK
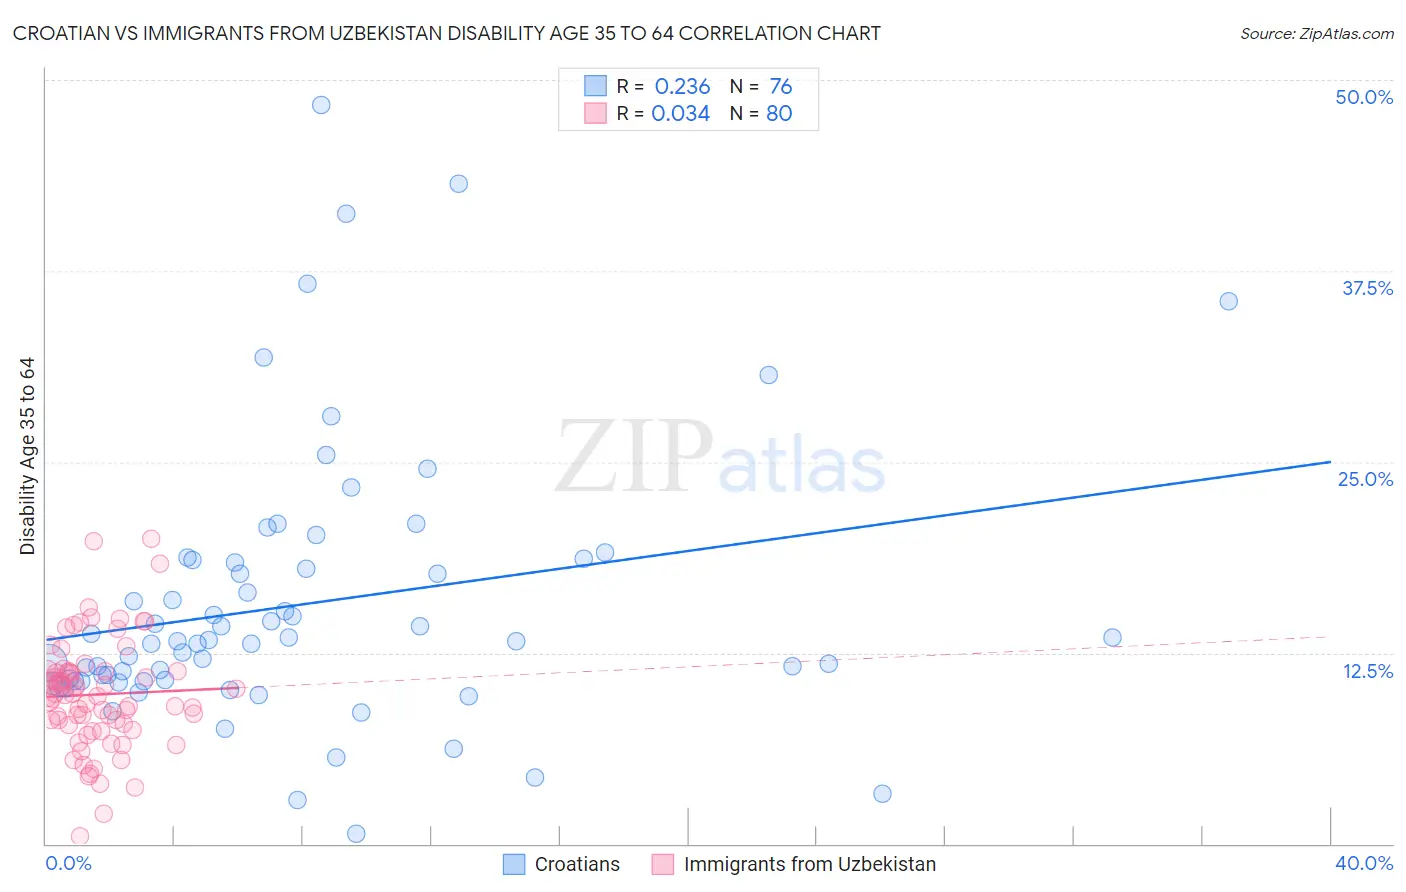
Croatian vs Immigrants from Uzbekistan Disability Age 35 to 64 Correlation Chart
The statistical analysis conducted on geographies consisting of 375,480,501 people shows a weak positive correlation between the proportion of Croatians and percentage of population with a disability between the ages 34 and 64 in the United States with a correlation coefficient (R) of 0.236 and weighted average of 11.0%. Similarly, the statistical analysis conducted on geographies consisting of 118,686,490 people shows no correlation between the proportion of Immigrants from Uzbekistan and percentage of population with a disability between the ages 34 and 64 in the United States with a correlation coefficient (R) of 0.034 and weighted average of 10.1%, a difference of 9.8%.
Disability Age 35 to 64 Correlation Summary
| Measurement | Croatian | Immigrants from Uzbekistan |
| Minimum | 0.68% | 0.52% |
| Maximum | 48.4% | 20.0% |
| Range | 47.7% | 19.5% |
| Mean | 15.7% | 9.8% |
| Median | 13.3% | 9.7% |
| Interquartile 25% (IQ1) | 10.6% | 7.8% |
| Interquartile 75% (IQ3) | 18.5% | 11.3% |
| Interquartile Range (IQR) | 7.8% | 3.4% |
| Standard Deviation (Sample) | 8.9% | 3.6% |
| Standard Deviation (Population) | 8.9% | 3.6% |
Similar Demographics by Disability Age 35 to 64
Demographics Similar to Croatians by Disability Age 35 to 64
In terms of disability age 35 to 64, the demographic groups most similar to Croatians are Serbian (11.0%, a difference of 0.050%), Immigrants from North America (11.0%, a difference of 0.20%), Guyanese (11.0%, a difference of 0.21%), Immigrants from Guyana (11.1%, a difference of 0.30%), and Immigrants from Sierra Leone (11.0%, a difference of 0.34%).
| Demographics | Rating | Rank | Disability Age 35 to 64 |
| Immigrants | England | 77.4 /100 | #153 | Good 11.0% |
| Immigrants | Canada | 76.7 /100 | #154 | Good 11.0% |
| Moroccans | 76.4 /100 | #155 | Good 11.0% |
| Immigrants | Sierra Leone | 76.2 /100 | #156 | Good 11.0% |
| Guyanese | 75.1 /100 | #157 | Good 11.0% |
| Immigrants | North America | 74.9 /100 | #158 | Good 11.0% |
| Serbians | 73.6 /100 | #159 | Good 11.0% |
| Croatians | 73.1 /100 | #160 | Good 11.0% |
| Immigrants | Guyana | 70.1 /100 | #161 | Good 11.1% |
| Immigrants | Grenada | 68.4 /100 | #162 | Good 11.1% |
| Immigrants | St. Vincent and the Grenadines | 66.6 /100 | #163 | Good 11.1% |
| Pakistanis | 65.8 /100 | #164 | Good 11.1% |
| Immigrants | Western Europe | 65.2 /100 | #165 | Good 11.1% |
| Immigrants | Haiti | 63.8 /100 | #166 | Good 11.1% |
| Austrians | 63.2 /100 | #167 | Good 11.1% |
Demographics Similar to Immigrants from Uzbekistan by Disability Age 35 to 64
In terms of disability age 35 to 64, the demographic groups most similar to Immigrants from Uzbekistan are Immigrants from Switzerland (10.1%, a difference of 0.11%), Immigrants from Eastern Europe (10.1%, a difference of 0.12%), Immigrants from Nicaragua (10.1%, a difference of 0.14%), Immigrants from Kazakhstan (10.1%, a difference of 0.15%), and Cuban (10.0%, a difference of 0.35%).
| Demographics | Rating | Rank | Disability Age 35 to 64 |
| Immigrants | South America | 99.7 /100 | #60 | Exceptional 9.9% |
| Immigrants | Spain | 99.7 /100 | #61 | Exceptional 10.0% |
| Eastern Europeans | 99.7 /100 | #62 | Exceptional 10.0% |
| Immigrants | Czechoslovakia | 99.7 /100 | #63 | Exceptional 10.0% |
| Immigrants | Romania | 99.7 /100 | #64 | Exceptional 10.0% |
| Immigrants | Poland | 99.6 /100 | #65 | Exceptional 10.0% |
| Cubans | 99.6 /100 | #66 | Exceptional 10.0% |
| Immigrants | Uzbekistan | 99.5 /100 | #67 | Exceptional 10.1% |
| Immigrants | Switzerland | 99.5 /100 | #68 | Exceptional 10.1% |
| Immigrants | Eastern Europe | 99.5 /100 | #69 | Exceptional 10.1% |
| Immigrants | Nicaragua | 99.5 /100 | #70 | Exceptional 10.1% |
| Immigrants | Kazakhstan | 99.5 /100 | #71 | Exceptional 10.1% |
| Immigrants | Northern Europe | 99.5 /100 | #72 | Exceptional 10.1% |
| Immigrants | France | 99.5 /100 | #73 | Exceptional 10.1% |
| Laotians | 99.4 /100 | #74 | Exceptional 10.1% |