Creek vs Indian (Asian) Vision Disability
COMPARE
Creek
Indian (Asian)
Vision Disability
Vision Disability Comparison
Creek
Indians (Asian)
3.2%
VISION DISABILITY
0.0/ 100
METRIC RATING
340th/ 347
METRIC RANK
1.8%
VISION DISABILITY
100.0/ 100
METRIC RATING
16th/ 347
METRIC RANK
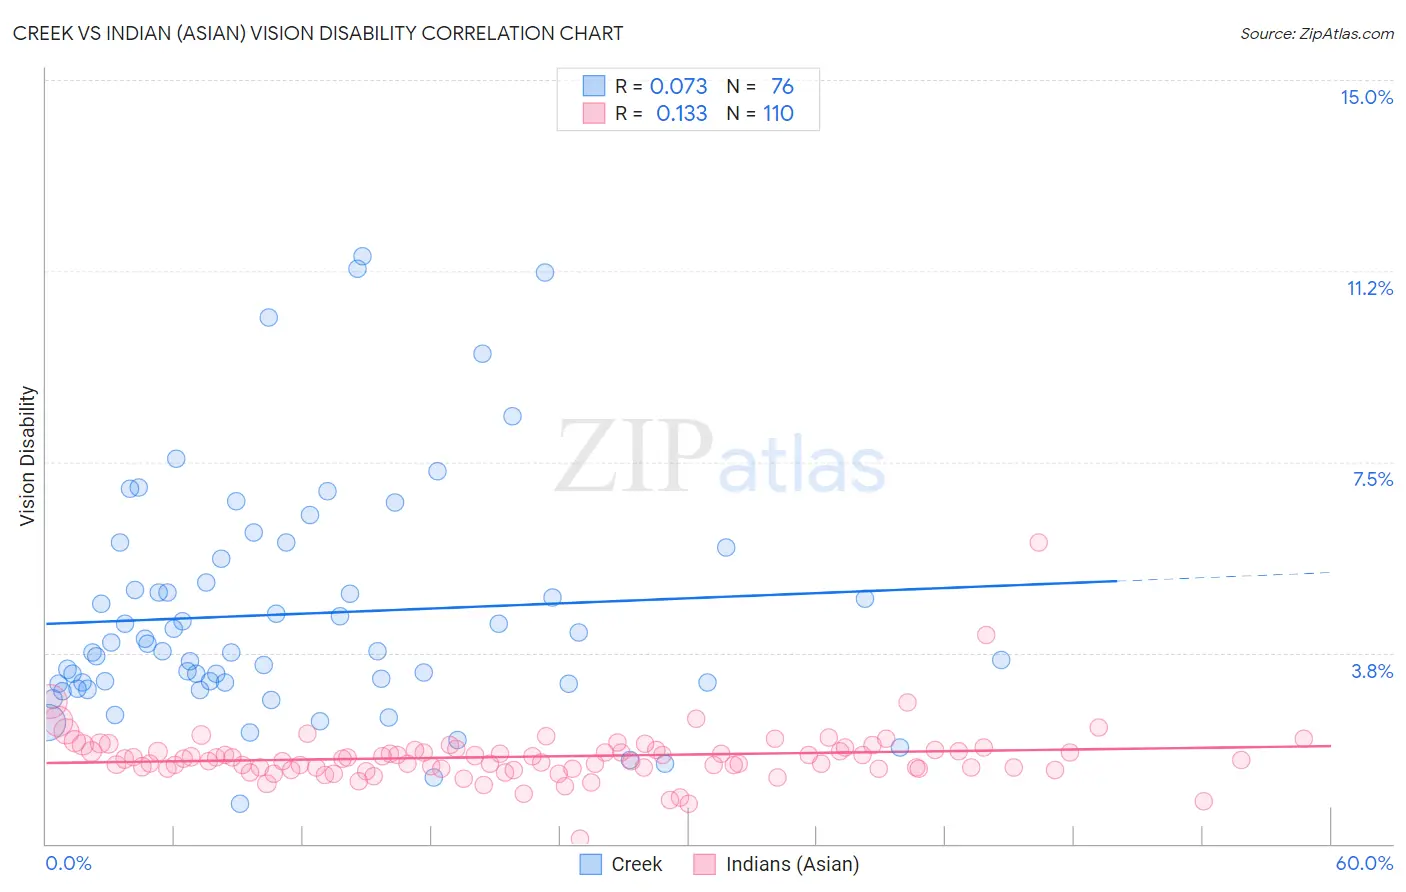
Creek vs Indian (Asian) Vision Disability Correlation Chart
The statistical analysis conducted on geographies consisting of 178,415,520 people shows a slight positive correlation between the proportion of Creek and percentage of population with vision disability in the United States with a correlation coefficient (R) of 0.073 and weighted average of 3.2%. Similarly, the statistical analysis conducted on geographies consisting of 494,549,615 people shows a poor positive correlation between the proportion of Indians (Asian) and percentage of population with vision disability in the United States with a correlation coefficient (R) of 0.133 and weighted average of 1.8%, a difference of 73.3%.
Vision Disability Correlation Summary
| Measurement | Creek | Indian (Asian) |
| Minimum | 0.78% | 0.11% |
| Maximum | 11.5% | 5.9% |
| Range | 10.8% | 5.8% |
| Mean | 4.5% | 1.7% |
| Median | 3.8% | 1.7% |
| Interquartile 25% (IQ1) | 3.2% | 1.5% |
| Interquartile 75% (IQ3) | 5.4% | 1.8% |
| Interquartile Range (IQR) | 2.2% | 0.36% |
| Standard Deviation (Sample) | 2.3% | 0.60% |
| Standard Deviation (Population) | 2.3% | 0.60% |
Similar Demographics by Vision Disability
Demographics Similar to Creek by Vision Disability
In terms of vision disability, the demographic groups most similar to Creek are Tsimshian (3.2%, a difference of 0.13%), Chickasaw (3.2%, a difference of 0.82%), Kiowa (3.3%, a difference of 1.4%), Dutch West Indian (3.2%, a difference of 1.7%), and Alaskan Athabascan (3.1%, a difference of 1.8%).
| Demographics | Rating | Rank | Vision Disability |
| Cajuns | 0.0 /100 | #333 | Tragic 3.1% |
| Cheyenne | 0.0 /100 | #334 | Tragic 3.1% |
| Navajo | 0.0 /100 | #335 | Tragic 3.1% |
| Alaskan Athabascans | 0.0 /100 | #336 | Tragic 3.1% |
| Dutch West Indians | 0.0 /100 | #337 | Tragic 3.2% |
| Chickasaw | 0.0 /100 | #338 | Tragic 3.2% |
| Tsimshian | 0.0 /100 | #339 | Tragic 3.2% |
| Creek | 0.0 /100 | #340 | Tragic 3.2% |
| Kiowa | 0.0 /100 | #341 | Tragic 3.3% |
| Choctaw | 0.0 /100 | #342 | Tragic 3.3% |
| Pima | 0.0 /100 | #343 | Tragic 3.3% |
| Pueblo | 0.0 /100 | #344 | Tragic 3.3% |
| Lumbee | 0.0 /100 | #345 | Tragic 3.4% |
| Houma | 0.0 /100 | #346 | Tragic 3.4% |
| Puerto Ricans | 0.0 /100 | #347 | Tragic 3.9% |
Demographics Similar to Indians (Asian) by Vision Disability
In terms of vision disability, the demographic groups most similar to Indians (Asian) are Burmese (1.8%, a difference of 0.010%), Bolivian (1.9%, a difference of 0.42%), Immigrants from Bolivia (1.8%, a difference of 0.44%), Immigrants from China (1.8%, a difference of 0.87%), and Immigrants from Eastern Asia (1.8%, a difference of 1.0%).
| Demographics | Rating | Rank | Vision Disability |
| Immigrants | Singapore | 100.0 /100 | #9 | Exceptional 1.8% |
| Immigrants | Hong Kong | 100.0 /100 | #10 | Exceptional 1.8% |
| Immigrants | Israel | 100.0 /100 | #11 | Exceptional 1.8% |
| Immigrants | Korea | 100.0 /100 | #12 | Exceptional 1.8% |
| Immigrants | Eastern Asia | 100.0 /100 | #13 | Exceptional 1.8% |
| Immigrants | China | 100.0 /100 | #14 | Exceptional 1.8% |
| Immigrants | Bolivia | 100.0 /100 | #15 | Exceptional 1.8% |
| Indians (Asian) | 100.0 /100 | #16 | Exceptional 1.8% |
| Burmese | 100.0 /100 | #17 | Exceptional 1.8% |
| Bolivians | 100.0 /100 | #18 | Exceptional 1.9% |
| Immigrants | Sri Lanka | 100.0 /100 | #19 | Exceptional 1.9% |
| Asians | 100.0 /100 | #20 | Exceptional 1.9% |
| Turks | 100.0 /100 | #21 | Exceptional 1.9% |
| Immigrants | Pakistan | 100.0 /100 | #22 | Exceptional 1.9% |
| Immigrants | Asia | 99.9 /100 | #23 | Exceptional 1.9% |