Creek vs African 1st Grade
COMPARE
Creek
African
1st Grade
1st Grade Comparison
Creek
Africans
98.4%
1ST GRADE
99.7/ 100
METRIC RATING
59th/ 347
METRIC RANK
97.8%
1ST GRADE
16.5/ 100
METRIC RATING
207th/ 347
METRIC RANK
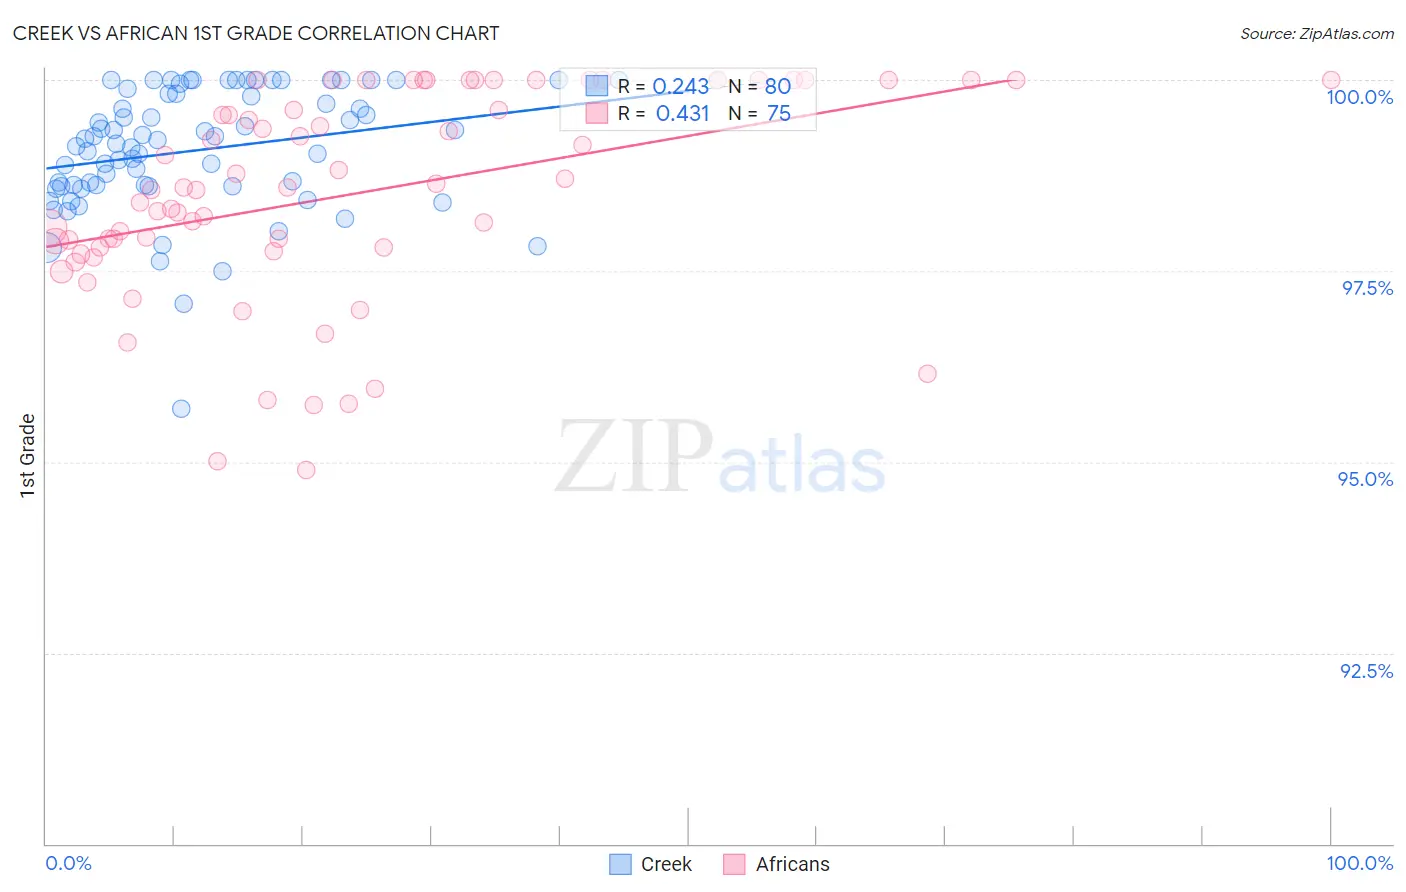
Creek vs African 1st Grade Correlation Chart
The statistical analysis conducted on geographies consisting of 178,480,663 people shows a weak positive correlation between the proportion of Creek and percentage of population with at least 1st grade education in the United States with a correlation coefficient (R) of 0.243 and weighted average of 98.4%. Similarly, the statistical analysis conducted on geographies consisting of 470,094,148 people shows a moderate positive correlation between the proportion of Africans and percentage of population with at least 1st grade education in the United States with a correlation coefficient (R) of 0.431 and weighted average of 97.8%, a difference of 0.59%.
1st Grade Correlation Summary
| Measurement | Creek | African |
| Minimum | 95.7% | 94.9% |
| Maximum | 100.0% | 100.0% |
| Range | 4.3% | 5.1% |
| Mean | 99.1% | 98.5% |
| Median | 99.2% | 98.6% |
| Interquartile 25% (IQ1) | 98.6% | 97.8% |
| Interquartile 75% (IQ3) | 99.8% | 100.0% |
| Interquartile Range (IQR) | 1.2% | 2.2% |
| Standard Deviation (Sample) | 0.82% | 1.4% |
| Standard Deviation (Population) | 0.81% | 1.4% |
Similar Demographics by 1st Grade
Demographics Similar to Creek by 1st Grade
In terms of 1st grade, the demographic groups most similar to Creek are New Zealander (98.4%, a difference of 0.0%), Immigrants from Canada (98.4%, a difference of 0.0%), Bulgarian (98.4%, a difference of 0.0%), Slavic (98.4%, a difference of 0.0%), and Immigrants from North America (98.4%, a difference of 0.0%).
| Demographics | Rating | Rank | 1st Grade |
| Pueblo | 99.8 /100 | #52 | Exceptional 98.4% |
| Kiowa | 99.8 /100 | #53 | Exceptional 98.4% |
| Australians | 99.8 /100 | #54 | Exceptional 98.4% |
| Immigrants | Scotland | 99.8 /100 | #55 | Exceptional 98.4% |
| Americans | 99.8 /100 | #56 | Exceptional 98.4% |
| Austrians | 99.8 /100 | #57 | Exceptional 98.4% |
| New Zealanders | 99.7 /100 | #58 | Exceptional 98.4% |
| Creek | 99.7 /100 | #59 | Exceptional 98.4% |
| Immigrants | Canada | 99.7 /100 | #60 | Exceptional 98.4% |
| Bulgarians | 99.7 /100 | #61 | Exceptional 98.4% |
| Slavs | 99.7 /100 | #62 | Exceptional 98.4% |
| Immigrants | North America | 99.7 /100 | #63 | Exceptional 98.4% |
| Greeks | 99.7 /100 | #64 | Exceptional 98.4% |
| Maltese | 99.7 /100 | #65 | Exceptional 98.4% |
| Canadians | 99.6 /100 | #66 | Exceptional 98.3% |
Demographics Similar to Africans by 1st Grade
In terms of 1st grade, the demographic groups most similar to Africans are Immigrants from Albania (97.8%, a difference of 0.0%), Immigrants from Ukraine (97.8%, a difference of 0.010%), Immigrants from Southern Europe (97.8%, a difference of 0.010%), Immigrants from Uganda (97.8%, a difference of 0.010%), and Immigrants from Chile (97.8%, a difference of 0.010%).
| Demographics | Rating | Rank | 1st Grade |
| Immigrants | Egypt | 22.6 /100 | #200 | Fair 97.8% |
| Immigrants | Lebanon | 20.1 /100 | #201 | Fair 97.8% |
| Immigrants | Ukraine | 19.2 /100 | #202 | Poor 97.8% |
| Immigrants | Southern Europe | 18.2 /100 | #203 | Poor 97.8% |
| Immigrants | Uganda | 18.2 /100 | #204 | Poor 97.8% |
| Immigrants | Chile | 17.7 /100 | #205 | Poor 97.8% |
| Immigrants | Albania | 17.3 /100 | #206 | Poor 97.8% |
| Africans | 16.5 /100 | #207 | Poor 97.8% |
| Immigrants | Northern Africa | 12.0 /100 | #208 | Poor 97.8% |
| Costa Ricans | 11.6 /100 | #209 | Poor 97.8% |
| Immigrants | Oceania | 11.0 /100 | #210 | Poor 97.8% |
| Laotians | 10.3 /100 | #211 | Poor 97.8% |
| Moroccans | 8.7 /100 | #212 | Tragic 97.7% |
| Immigrants | Bahamas | 8.1 /100 | #213 | Tragic 97.7% |
| South American Indians | 7.6 /100 | #214 | Tragic 97.7% |