Cree vs Immigrants from India Disability Age 18 to 34
COMPARE
Cree
Immigrants from India
Disability Age 18 to 34
Disability Age 18 to 34 Comparison
Cree
Immigrants from India
8.1%
DISABILITY AGE 18 TO 34
0.0/ 100
METRIC RATING
322nd/ 347
METRIC RANK
5.6%
DISABILITY AGE 18 TO 34
100.0/ 100
METRIC RATING
15th/ 347
METRIC RANK
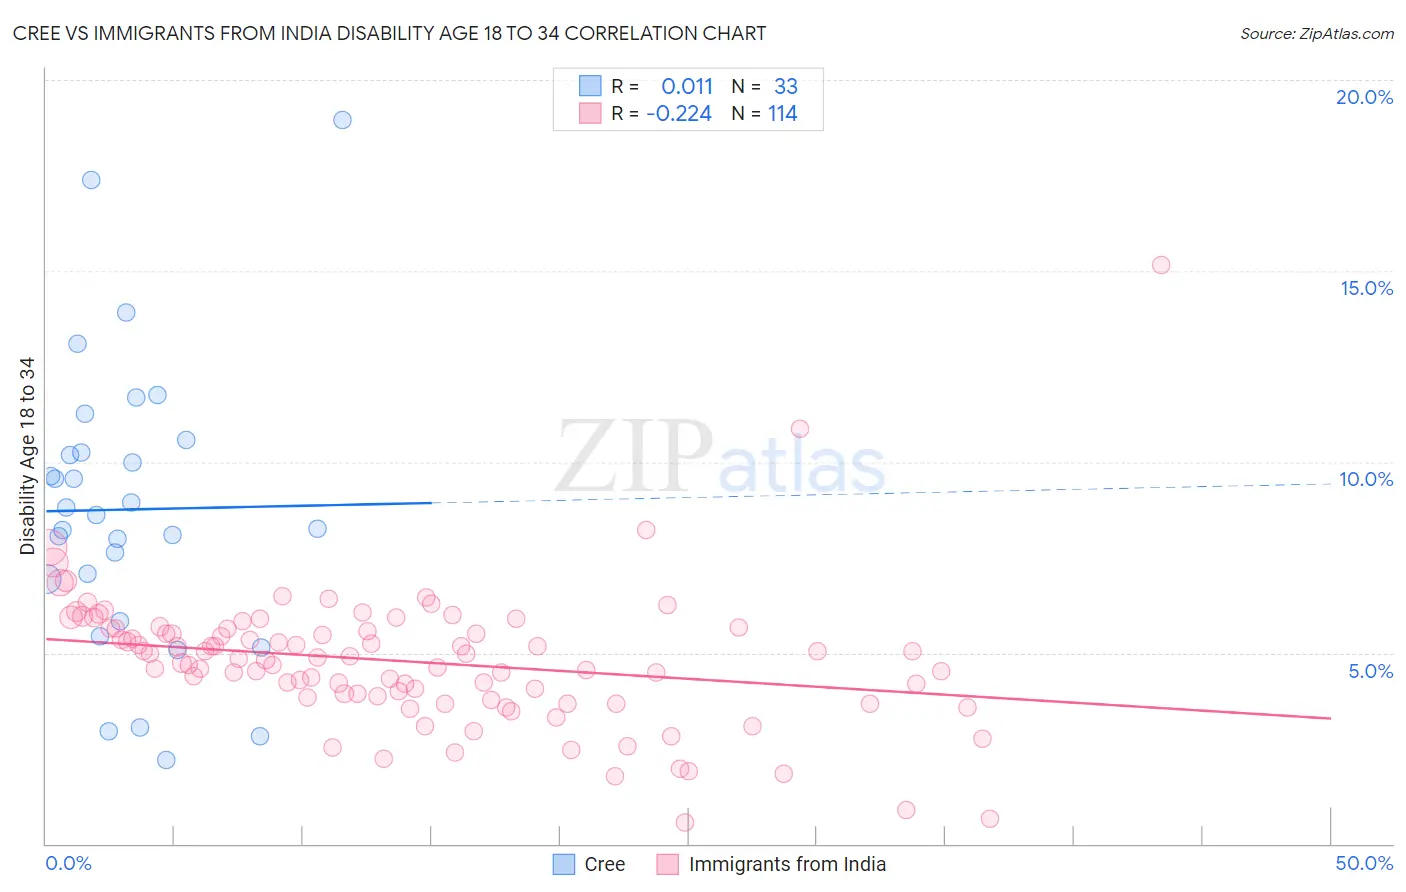
Cree vs Immigrants from India Disability Age 18 to 34 Correlation Chart
The statistical analysis conducted on geographies consisting of 76,144,663 people shows no correlation between the proportion of Cree and percentage of population with a disability between the ages 18 and 35 in the United States with a correlation coefficient (R) of 0.011 and weighted average of 8.1%. Similarly, the statistical analysis conducted on geographies consisting of 433,147,761 people shows a weak negative correlation between the proportion of Immigrants from India and percentage of population with a disability between the ages 18 and 35 in the United States with a correlation coefficient (R) of -0.224 and weighted average of 5.6%, a difference of 45.9%.
Disability Age 18 to 34 Correlation Summary
| Measurement | Cree | Immigrants from India |
| Minimum | 2.2% | 0.57% |
| Maximum | 19.0% | 15.2% |
| Range | 16.8% | 14.6% |
| Mean | 8.8% | 4.8% |
| Median | 8.6% | 4.9% |
| Interquartile 25% (IQ1) | 6.4% | 3.8% |
| Interquartile 75% (IQ3) | 10.4% | 5.6% |
| Interquartile Range (IQR) | 4.0% | 1.8% |
| Standard Deviation (Sample) | 3.8% | 1.8% |
| Standard Deviation (Population) | 3.7% | 1.8% |
Similar Demographics by Disability Age 18 to 34
Demographics Similar to Cree by Disability Age 18 to 34
In terms of disability age 18 to 34, the demographic groups most similar to Cree are Blackfeet (8.1%, a difference of 0.060%), Navajo (8.1%, a difference of 0.42%), Aleut (8.1%, a difference of 0.46%), French Canadian (8.1%, a difference of 0.51%), and French American Indian (8.2%, a difference of 0.51%).
| Demographics | Rating | Rank | Disability Age 18 to 34 |
| Americans | 0.0 /100 | #315 | Tragic 8.0% |
| Puerto Ricans | 0.0 /100 | #316 | Tragic 8.0% |
| Hmong | 0.0 /100 | #317 | Tragic 8.1% |
| French Canadians | 0.0 /100 | #318 | Tragic 8.1% |
| Aleuts | 0.0 /100 | #319 | Tragic 8.1% |
| Navajo | 0.0 /100 | #320 | Tragic 8.1% |
| Blackfeet | 0.0 /100 | #321 | Tragic 8.1% |
| Cree | 0.0 /100 | #322 | Tragic 8.1% |
| French American Indians | 0.0 /100 | #323 | Tragic 8.2% |
| Cajuns | 0.0 /100 | #324 | Tragic 8.2% |
| Natives/Alaskans | 0.0 /100 | #325 | Tragic 8.2% |
| Potawatomi | 0.0 /100 | #326 | Tragic 8.2% |
| Sioux | 0.0 /100 | #327 | Tragic 8.2% |
| Delaware | 0.0 /100 | #328 | Tragic 8.2% |
| Crow | 0.0 /100 | #329 | Tragic 8.3% |
Demographics Similar to Immigrants from India by Disability Age 18 to 34
In terms of disability age 18 to 34, the demographic groups most similar to Immigrants from India are Immigrants from Israel (5.6%, a difference of 0.030%), Immigrants from Eastern Asia (5.6%, a difference of 0.20%), Indian (Asian) (5.5%, a difference of 0.38%), Immigrants from Iran (5.5%, a difference of 0.53%), and Immigrants from St. Vincent and the Grenadines (5.5%, a difference of 0.85%).
| Demographics | Rating | Rank | Disability Age 18 to 34 |
| Immigrants | Guyana | 100.0 /100 | #8 | Exceptional 5.5% |
| Guyanese | 100.0 /100 | #9 | Exceptional 5.5% |
| Immigrants | Uzbekistan | 100.0 /100 | #10 | Exceptional 5.5% |
| Vietnamese | 100.0 /100 | #11 | Exceptional 5.5% |
| Immigrants | St. Vincent and the Grenadines | 100.0 /100 | #12 | Exceptional 5.5% |
| Immigrants | Iran | 100.0 /100 | #13 | Exceptional 5.5% |
| Indians (Asian) | 100.0 /100 | #14 | Exceptional 5.5% |
| Immigrants | India | 100.0 /100 | #15 | Exceptional 5.6% |
| Immigrants | Israel | 100.0 /100 | #16 | Exceptional 5.6% |
| Immigrants | Eastern Asia | 100.0 /100 | #17 | Exceptional 5.6% |
| Immigrants | Bolivia | 100.0 /100 | #18 | Exceptional 5.6% |
| Thais | 100.0 /100 | #19 | Exceptional 5.6% |
| Immigrants | Bangladesh | 100.0 /100 | #20 | Exceptional 5.6% |
| Immigrants | South Central Asia | 100.0 /100 | #21 | Exceptional 5.7% |
| Immigrants | Nicaragua | 100.0 /100 | #22 | Exceptional 5.7% |