Cree vs Immigrants from Canada Disability Age 18 to 34
COMPARE
Cree
Immigrants from Canada
Disability Age 18 to 34
Disability Age 18 to 34 Comparison
Cree
Immigrants from Canada
8.1%
DISABILITY AGE 18 TO 34
0.0/ 100
METRIC RATING
322nd/ 347
METRIC RANK
7.0%
DISABILITY AGE 18 TO 34
4.3/ 100
METRIC RATING
227th/ 347
METRIC RANK
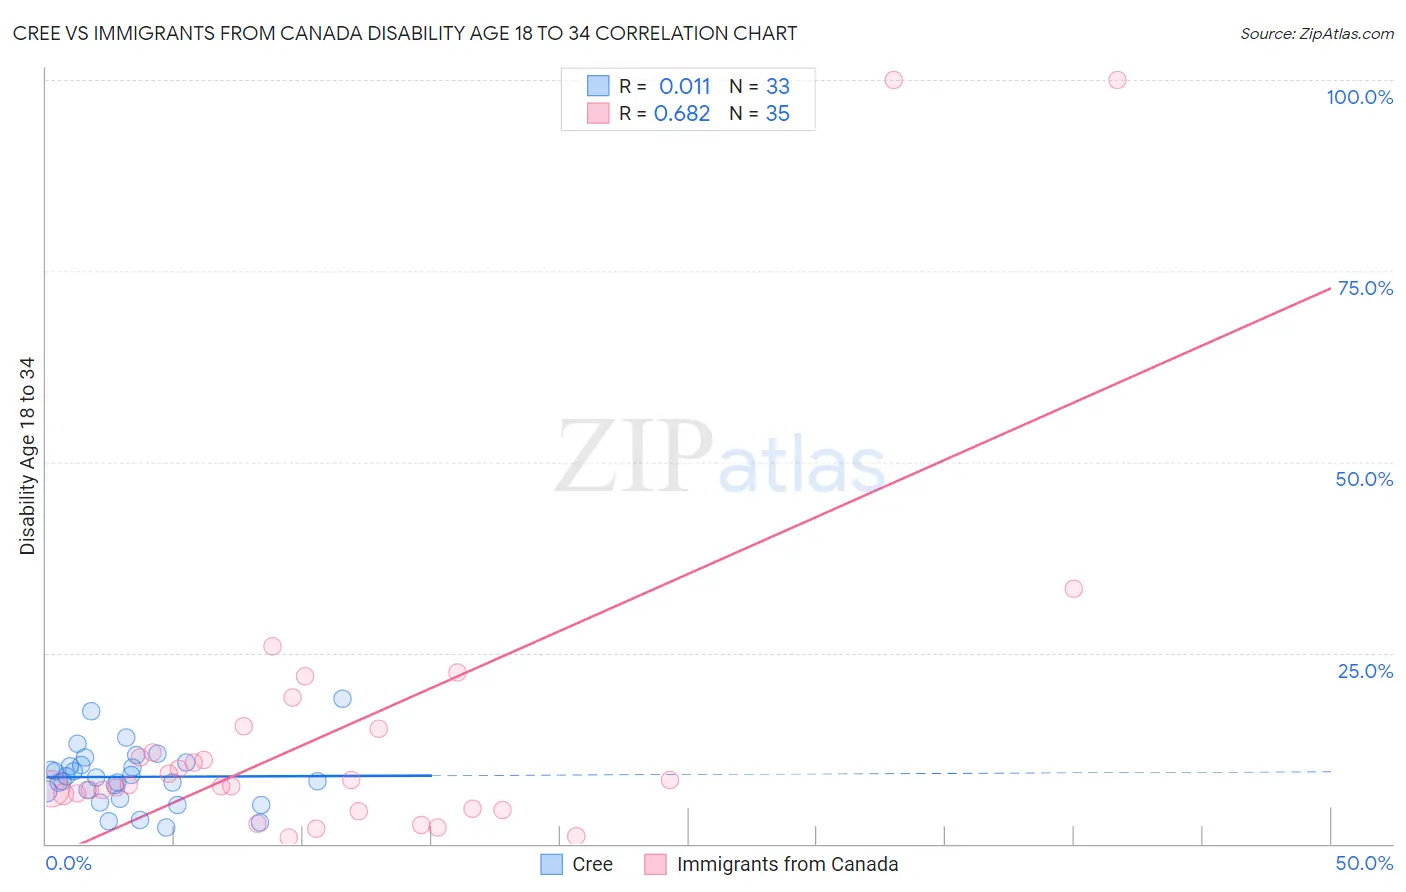
Cree vs Immigrants from Canada Disability Age 18 to 34 Correlation Chart
The statistical analysis conducted on geographies consisting of 76,144,663 people shows no correlation between the proportion of Cree and percentage of population with a disability between the ages 18 and 35 in the United States with a correlation coefficient (R) of 0.011 and weighted average of 8.1%. Similarly, the statistical analysis conducted on geographies consisting of 457,531,429 people shows a significant positive correlation between the proportion of Immigrants from Canada and percentage of population with a disability between the ages 18 and 35 in the United States with a correlation coefficient (R) of 0.682 and weighted average of 7.0%, a difference of 16.9%.
Disability Age 18 to 34 Correlation Summary
| Measurement | Cree | Immigrants from Canada |
| Minimum | 2.2% | 0.83% |
| Maximum | 19.0% | 100.0% |
| Range | 16.8% | 99.2% |
| Mean | 8.8% | 14.9% |
| Median | 8.6% | 7.7% |
| Interquartile 25% (IQ1) | 6.4% | 4.5% |
| Interquartile 75% (IQ3) | 10.4% | 15.0% |
| Interquartile Range (IQR) | 4.0% | 10.5% |
| Standard Deviation (Sample) | 3.8% | 22.5% |
| Standard Deviation (Population) | 3.7% | 22.1% |
Similar Demographics by Disability Age 18 to 34
Demographics Similar to Cree by Disability Age 18 to 34
In terms of disability age 18 to 34, the demographic groups most similar to Cree are Blackfeet (8.1%, a difference of 0.060%), Navajo (8.1%, a difference of 0.42%), Aleut (8.1%, a difference of 0.46%), French Canadian (8.1%, a difference of 0.51%), and French American Indian (8.2%, a difference of 0.51%).
| Demographics | Rating | Rank | Disability Age 18 to 34 |
| Americans | 0.0 /100 | #315 | Tragic 8.0% |
| Puerto Ricans | 0.0 /100 | #316 | Tragic 8.0% |
| Hmong | 0.0 /100 | #317 | Tragic 8.1% |
| French Canadians | 0.0 /100 | #318 | Tragic 8.1% |
| Aleuts | 0.0 /100 | #319 | Tragic 8.1% |
| Navajo | 0.0 /100 | #320 | Tragic 8.1% |
| Blackfeet | 0.0 /100 | #321 | Tragic 8.1% |
| Cree | 0.0 /100 | #322 | Tragic 8.1% |
| French American Indians | 0.0 /100 | #323 | Tragic 8.2% |
| Cajuns | 0.0 /100 | #324 | Tragic 8.2% |
| Natives/Alaskans | 0.0 /100 | #325 | Tragic 8.2% |
| Potawatomi | 0.0 /100 | #326 | Tragic 8.2% |
| Sioux | 0.0 /100 | #327 | Tragic 8.2% |
| Delaware | 0.0 /100 | #328 | Tragic 8.2% |
| Crow | 0.0 /100 | #329 | Tragic 8.3% |
Demographics Similar to Immigrants from Canada by Disability Age 18 to 34
In terms of disability age 18 to 34, the demographic groups most similar to Immigrants from Canada are Ugandan (6.9%, a difference of 0.050%), Immigrants from Yemen (7.0%, a difference of 0.050%), Lithuanian (7.0%, a difference of 0.080%), Central American Indian (6.9%, a difference of 0.15%), and Immigrants from North America (7.0%, a difference of 0.18%).
| Demographics | Rating | Rank | Disability Age 18 to 34 |
| Immigrants | Senegal | 5.5 /100 | #220 | Tragic 6.9% |
| Immigrants | Middle Africa | 5.5 /100 | #221 | Tragic 6.9% |
| Immigrants | England | 5.3 /100 | #222 | Tragic 6.9% |
| Carpatho Rusyns | 5.2 /100 | #223 | Tragic 6.9% |
| Senegalese | 4.9 /100 | #224 | Tragic 6.9% |
| Central American Indians | 4.7 /100 | #225 | Tragic 6.9% |
| Ugandans | 4.4 /100 | #226 | Tragic 6.9% |
| Immigrants | Canada | 4.3 /100 | #227 | Tragic 7.0% |
| Immigrants | Yemen | 4.2 /100 | #228 | Tragic 7.0% |
| Lithuanians | 4.1 /100 | #229 | Tragic 7.0% |
| Immigrants | North America | 3.9 /100 | #230 | Tragic 7.0% |
| Ute | 3.8 /100 | #231 | Tragic 7.0% |
| Samoans | 3.2 /100 | #232 | Tragic 7.0% |
| New Zealanders | 2.7 /100 | #233 | Tragic 7.0% |
| Alsatians | 2.1 /100 | #234 | Tragic 7.0% |