Immigrants from Denmark vs Brazilian Disability Age 35 to 64
COMPARE
Immigrants from Denmark
Brazilian
Disability Age 35 to 64
Disability Age 35 to 64 Comparison
Immigrants from Denmark
Brazilians
10.3%
DISABILITY AGE 35 TO 64
98.4/ 100
METRIC RATING
97th/ 347
METRIC RANK
10.5%
DISABILITY AGE 35 TO 64
96.9/ 100
METRIC RATING
111th/ 347
METRIC RANK
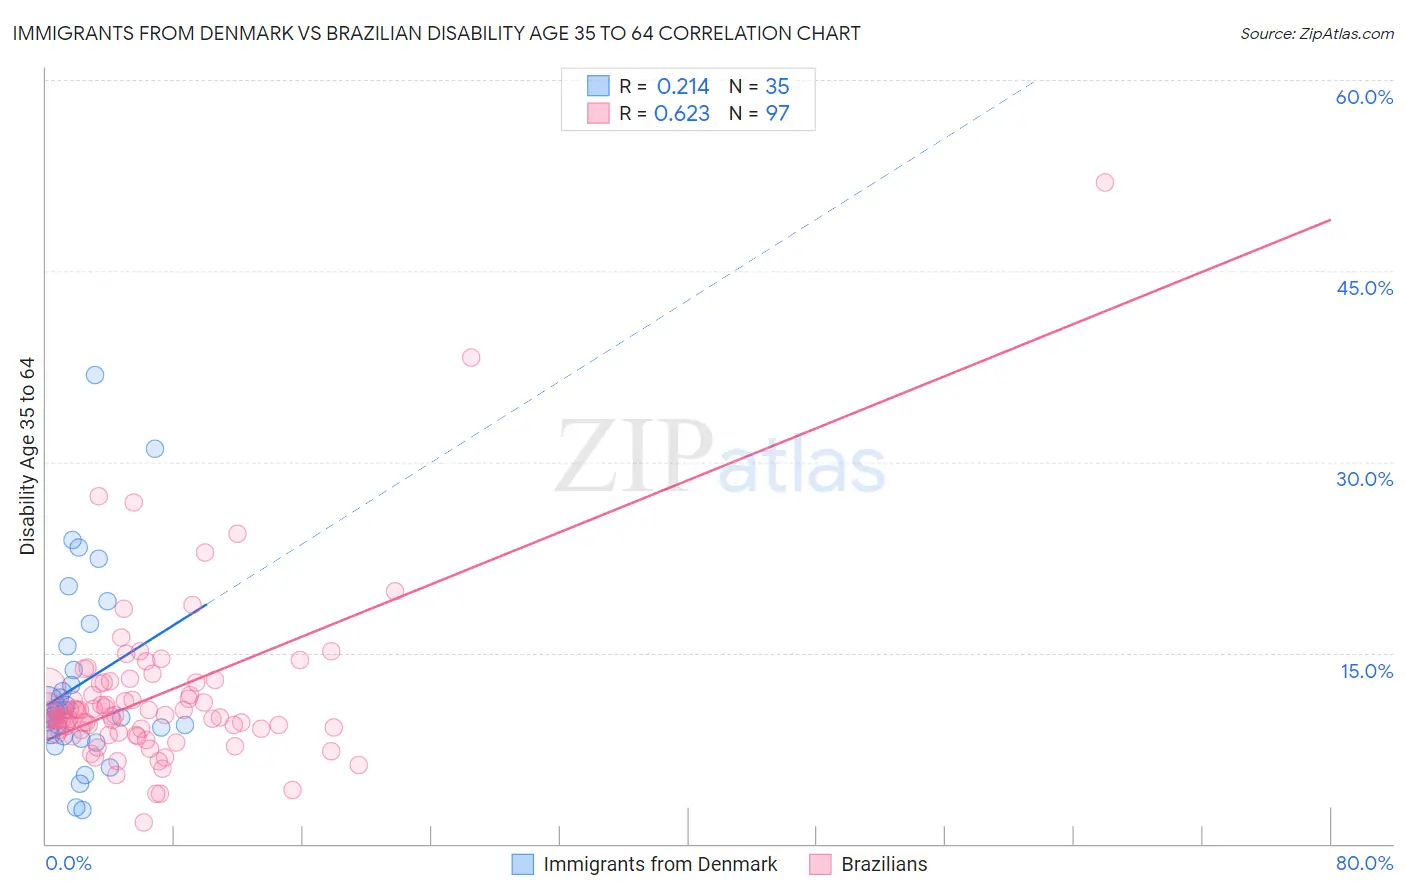
Immigrants from Denmark vs Brazilian Disability Age 35 to 64 Correlation Chart
The statistical analysis conducted on geographies consisting of 136,399,162 people shows a weak positive correlation between the proportion of Immigrants from Denmark and percentage of population with a disability between the ages 34 and 64 in the United States with a correlation coefficient (R) of 0.214 and weighted average of 10.3%. Similarly, the statistical analysis conducted on geographies consisting of 323,696,465 people shows a significant positive correlation between the proportion of Brazilians and percentage of population with a disability between the ages 34 and 64 in the United States with a correlation coefficient (R) of 0.623 and weighted average of 10.5%, a difference of 1.5%.
Disability Age 35 to 64 Correlation Summary
| Measurement | Immigrants from Denmark | Brazilian |
| Minimum | 2.6% | 1.7% |
| Maximum | 36.8% | 51.9% |
| Range | 34.2% | 50.2% |
| Mean | 12.6% | 11.6% |
| Median | 10.5% | 10.1% |
| Interquartile 25% (IQ1) | 8.4% | 8.8% |
| Interquartile 75% (IQ3) | 15.5% | 12.6% |
| Interquartile Range (IQR) | 7.1% | 3.8% |
| Standard Deviation (Sample) | 7.5% | 6.6% |
| Standard Deviation (Population) | 7.4% | 6.5% |
Demographics Similar to Immigrants from Denmark and Brazilians by Disability Age 35 to 64
In terms of disability age 35 to 64, the demographic groups most similar to Immigrants from Denmark are Immigrants from Uruguay (10.3%, a difference of 0.070%), Immigrants from South Africa (10.3%, a difference of 0.18%), Palestinian (10.4%, a difference of 0.20%), Immigrants from Italy (10.3%, a difference of 0.42%), and Chinese (10.3%, a difference of 0.42%). Similarly, the demographic groups most similar to Brazilians are Assyrian/Chaldean/Syriac (10.5%, a difference of 0.030%), Tongan (10.5%, a difference of 0.15%), Korean (10.5%, a difference of 0.20%), Immigrants from Morocco (10.5%, a difference of 0.20%), and Immigrants from Ethiopia (10.5%, a difference of 0.27%).
| Demographics | Rating | Rank | Disability Age 35 to 64 |
| Immigrants | Italy | 98.7 /100 | #94 | Exceptional 10.3% |
| Chinese | 98.7 /100 | #95 | Exceptional 10.3% |
| Immigrants | South Africa | 98.5 /100 | #96 | Exceptional 10.3% |
| Immigrants | Denmark | 98.4 /100 | #97 | Exceptional 10.3% |
| Immigrants | Uruguay | 98.3 /100 | #98 | Exceptional 10.3% |
| Palestinians | 98.2 /100 | #99 | Exceptional 10.4% |
| Immigrants | Jordan | 98.1 /100 | #100 | Exceptional 10.4% |
| Immigrants | Philippines | 98.0 /100 | #101 | Exceptional 10.4% |
| Immigrants | Western Asia | 98.0 /100 | #102 | Exceptional 10.4% |
| Immigrants | Ukraine | 97.9 /100 | #103 | Exceptional 10.4% |
| Immigrants | Austria | 97.8 /100 | #104 | Exceptional 10.4% |
| Macedonians | 97.8 /100 | #105 | Exceptional 10.4% |
| Immigrants | Hungary | 97.6 /100 | #106 | Exceptional 10.4% |
| Zimbabweans | 97.4 /100 | #107 | Exceptional 10.4% |
| Ethiopians | 97.4 /100 | #108 | Exceptional 10.5% |
| Immigrants | Ethiopia | 97.2 /100 | #109 | Exceptional 10.5% |
| Koreans | 97.1 /100 | #110 | Exceptional 10.5% |
| Brazilians | 96.9 /100 | #111 | Exceptional 10.5% |
| Assyrians/Chaldeans/Syriacs | 96.8 /100 | #112 | Exceptional 10.5% |
| Tongans | 96.6 /100 | #113 | Exceptional 10.5% |
| Immigrants | Morocco | 96.6 /100 | #114 | Exceptional 10.5% |