Comanche vs Ottawa Disability Age 18 to 34
COMPARE
Comanche
Ottawa
Disability Age 18 to 34
Disability Age 18 to 34 Comparison
Comanche
Ottawa
8.3%
DISABILITY AGE 18 TO 34
0.0/ 100
METRIC RATING
331st/ 347
METRIC RANK
8.6%
DISABILITY AGE 18 TO 34
0.0/ 100
METRIC RATING
337th/ 347
METRIC RANK
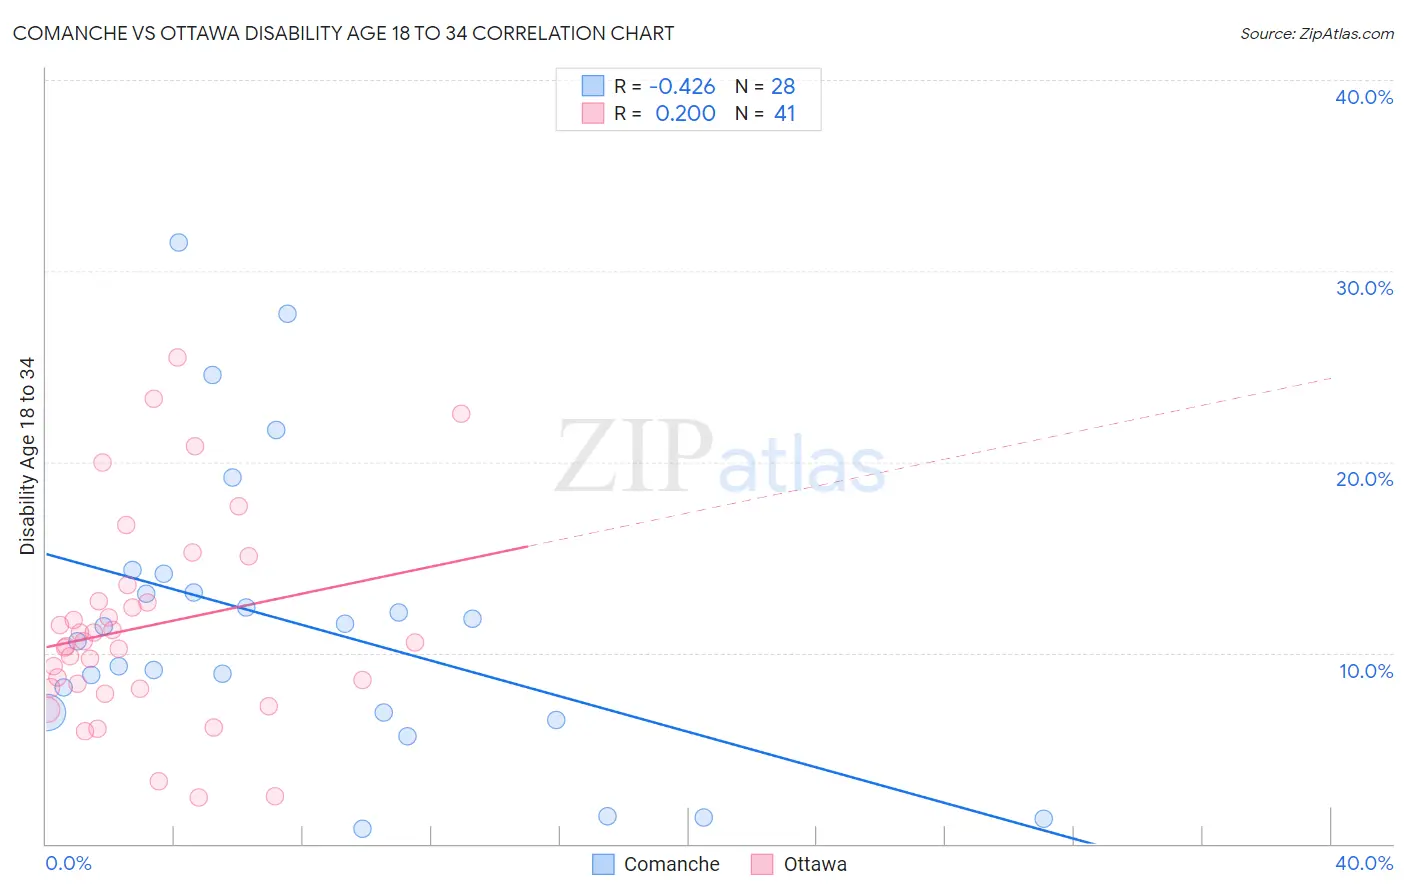
Comanche vs Ottawa Disability Age 18 to 34 Correlation Chart
The statistical analysis conducted on geographies consisting of 109,716,661 people shows a moderate negative correlation between the proportion of Comanche and percentage of population with a disability between the ages 18 and 35 in the United States with a correlation coefficient (R) of -0.426 and weighted average of 8.3%. Similarly, the statistical analysis conducted on geographies consisting of 49,926,401 people shows a poor positive correlation between the proportion of Ottawa and percentage of population with a disability between the ages 18 and 35 in the United States with a correlation coefficient (R) of 0.200 and weighted average of 8.6%, a difference of 3.3%.
Disability Age 18 to 34 Correlation Summary
| Measurement | Comanche | Ottawa |
| Minimum | 0.77% | 2.4% |
| Maximum | 31.5% | 25.5% |
| Range | 30.7% | 23.0% |
| Mean | 11.6% | 11.4% |
| Median | 11.0% | 10.5% |
| Interquartile 25% (IQ1) | 6.9% | 8.1% |
| Interquartile 75% (IQ3) | 13.6% | 13.1% |
| Interquartile Range (IQR) | 6.8% | 5.0% |
| Standard Deviation (Sample) | 7.6% | 5.4% |
| Standard Deviation (Population) | 7.5% | 5.3% |
Demographics Similar to Comanche and Ottawa by Disability Age 18 to 34
In terms of disability age 18 to 34, the demographic groups most similar to Comanche are Osage (8.3%, a difference of 0.18%), Puget Sound Salish (8.3%, a difference of 0.22%), Crow (8.3%, a difference of 0.44%), Delaware (8.2%, a difference of 0.96%), and Sioux (8.2%, a difference of 1.0%). Similarly, the demographic groups most similar to Ottawa are Immigrants from the Azores (8.5%, a difference of 0.47%), Cherokee (8.7%, a difference of 1.5%), Seminole (8.4%, a difference of 1.7%), Dutch West Indian (8.4%, a difference of 1.8%), and Apache (8.4%, a difference of 2.0%).
| Demographics | Rating | Rank | Disability Age 18 to 34 |
| Cajuns | 0.0 /100 | #324 | Tragic 8.2% |
| Natives/Alaskans | 0.0 /100 | #325 | Tragic 8.2% |
| Potawatomi | 0.0 /100 | #326 | Tragic 8.2% |
| Sioux | 0.0 /100 | #327 | Tragic 8.2% |
| Delaware | 0.0 /100 | #328 | Tragic 8.2% |
| Crow | 0.0 /100 | #329 | Tragic 8.3% |
| Osage | 0.0 /100 | #330 | Tragic 8.3% |
| Comanche | 0.0 /100 | #331 | Tragic 8.3% |
| Puget Sound Salish | 0.0 /100 | #332 | Tragic 8.3% |
| Apache | 0.0 /100 | #333 | Tragic 8.4% |
| Dutch West Indians | 0.0 /100 | #334 | Tragic 8.4% |
| Seminole | 0.0 /100 | #335 | Tragic 8.4% |
| Immigrants | Azores | 0.0 /100 | #336 | Tragic 8.5% |
| Ottawa | 0.0 /100 | #337 | Tragic 8.6% |
| Cherokee | 0.0 /100 | #338 | Tragic 8.7% |
| Kiowa | 0.0 /100 | #339 | Tragic 8.8% |
| Choctaw | 0.0 /100 | #340 | Tragic 9.0% |
| Chickasaw | 0.0 /100 | #341 | Tragic 9.0% |
| Yakama | 0.0 /100 | #342 | Tragic 9.0% |
| Chippewa | 0.0 /100 | #343 | Tragic 9.0% |
| Creek | 0.0 /100 | #344 | Tragic 9.0% |