Chippewa vs African Disability Age 35 to 64
COMPARE
Chippewa
African
Disability Age 35 to 64
Disability Age 35 to 64 Comparison
Chippewa
Africans
15.0%
DISABILITY AGE 35 TO 64
0.0/ 100
METRIC RATING
324th/ 347
METRIC RANK
13.6%
DISABILITY AGE 35 TO 64
0.0/ 100
METRIC RATING
296th/ 347
METRIC RANK
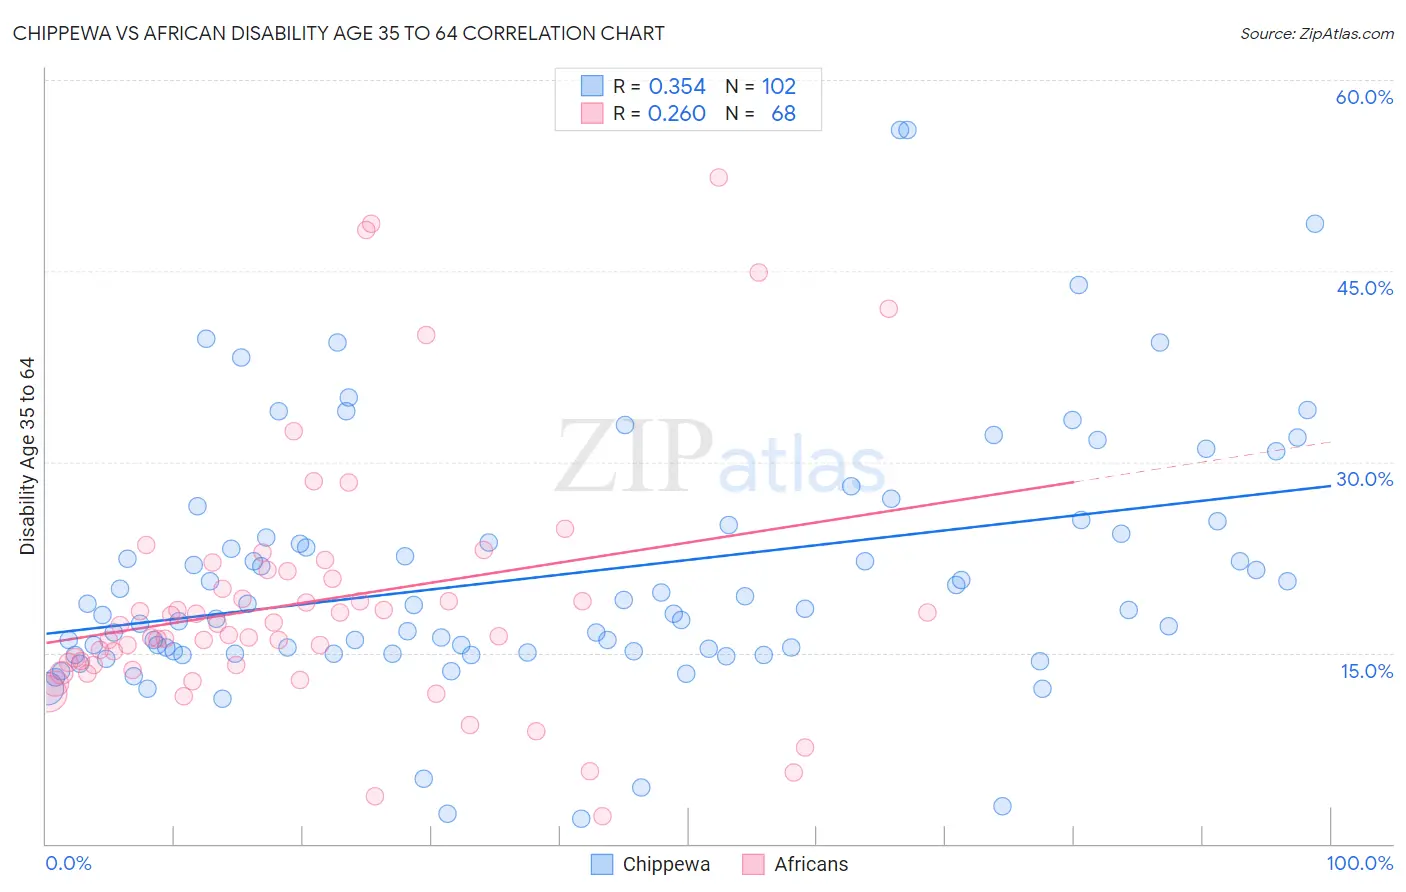
Chippewa vs African Disability Age 35 to 64 Correlation Chart
The statistical analysis conducted on geographies consisting of 214,987,125 people shows a mild positive correlation between the proportion of Chippewa and percentage of population with a disability between the ages 34 and 64 in the United States with a correlation coefficient (R) of 0.354 and weighted average of 15.0%. Similarly, the statistical analysis conducted on geographies consisting of 469,523,166 people shows a weak positive correlation between the proportion of Africans and percentage of population with a disability between the ages 34 and 64 in the United States with a correlation coefficient (R) of 0.260 and weighted average of 13.6%, a difference of 10.2%.
Disability Age 35 to 64 Correlation Summary
| Measurement | Chippewa | African |
| Minimum | 2.0% | 2.2% |
| Maximum | 56.1% | 52.4% |
| Range | 54.1% | 50.2% |
| Mean | 21.1% | 19.1% |
| Median | 18.4% | 16.8% |
| Interquartile 25% (IQ1) | 15.0% | 14.0% |
| Interquartile 75% (IQ3) | 24.3% | 21.1% |
| Interquartile Range (IQR) | 9.3% | 7.1% |
| Standard Deviation (Sample) | 10.0% | 10.1% |
| Standard Deviation (Population) | 9.9% | 10.0% |
Similar Demographics by Disability Age 35 to 64
Demographics Similar to Chippewa by Disability Age 35 to 64
In terms of disability age 35 to 64, the demographic groups most similar to Chippewa are Apache (14.9%, a difference of 0.20%), Arapaho (15.1%, a difference of 0.66%), Potawatomi (14.8%, a difference of 1.4%), Comanche (14.7%, a difference of 1.5%), and Black/African American (14.7%, a difference of 1.7%).
| Demographics | Rating | Rank | Disability Age 35 to 64 |
| Crow | 0.0 /100 | #317 | Tragic 14.6% |
| Ottawa | 0.0 /100 | #318 | Tragic 14.6% |
| Immigrants | Cabo Verde | 0.0 /100 | #319 | Tragic 14.7% |
| Blacks/African Americans | 0.0 /100 | #320 | Tragic 14.7% |
| Comanche | 0.0 /100 | #321 | Tragic 14.7% |
| Potawatomi | 0.0 /100 | #322 | Tragic 14.8% |
| Apache | 0.0 /100 | #323 | Tragic 14.9% |
| Chippewa | 0.0 /100 | #324 | Tragic 15.0% |
| Arapaho | 0.0 /100 | #325 | Tragic 15.1% |
| Natives/Alaskans | 0.0 /100 | #326 | Tragic 15.3% |
| Pueblo | 0.0 /100 | #327 | Tragic 15.3% |
| Cajuns | 0.0 /100 | #328 | Tragic 15.3% |
| Cherokee | 0.0 /100 | #329 | Tragic 15.5% |
| Navajo | 0.0 /100 | #330 | Tragic 15.5% |
| Dutch West Indians | 0.0 /100 | #331 | Tragic 15.6% |
Demographics Similar to Africans by Disability Age 35 to 64
In terms of disability age 35 to 64, the demographic groups most similar to Africans are Yakama (13.6%, a difference of 0.22%), Bangladeshi (13.6%, a difference of 0.35%), Cheyenne (13.6%, a difference of 0.38%), Spanish American (13.7%, a difference of 0.58%), and Delaware (13.7%, a difference of 0.66%).
| Demographics | Rating | Rank | Disability Age 35 to 64 |
| Indonesians | 0.0 /100 | #289 | Tragic 13.2% |
| Immigrants | Liberia | 0.0 /100 | #290 | Tragic 13.2% |
| Immigrants | Congo | 0.0 /100 | #291 | Tragic 13.3% |
| Puget Sound Salish | 0.0 /100 | #292 | Tragic 13.3% |
| Ute | 0.0 /100 | #293 | Tragic 13.4% |
| Yaqui | 0.0 /100 | #294 | Tragic 13.5% |
| Yakama | 0.0 /100 | #295 | Tragic 13.6% |
| Africans | 0.0 /100 | #296 | Tragic 13.6% |
| Bangladeshis | 0.0 /100 | #297 | Tragic 13.6% |
| Cheyenne | 0.0 /100 | #298 | Tragic 13.6% |
| Spanish Americans | 0.0 /100 | #299 | Tragic 13.7% |
| Delaware | 0.0 /100 | #300 | Tragic 13.7% |
| French American Indians | 0.0 /100 | #301 | Tragic 13.7% |
| Aleuts | 0.0 /100 | #302 | Tragic 13.8% |
| Sioux | 0.0 /100 | #303 | Tragic 13.9% |