Chippewa vs Immigrants from Morocco Disability Age 35 to 64

COMPARE

Chippewa
Race
Ancestry
AfghanAfricanAlaska NativeAlaskan AthabascanAlbanianAleutAlsatianAmericanApacheArabArapahoArgentineanArmenianAssyrian/Chaldean/SyriacAustralianAustrianBahamianBangladeshiBarbadianBasqueBelgianBelizeanBermudanBhutaneseBlackfeetBolivianBrazilianBritishBritish West IndianBulgarianBurmeseCajunCambodianCanadianCape VerdeanCarpatho RusynCelticCentral AmericanCentral American IndianCherokeeCheyenneChickasawChileanChineseChippewaChoctawColombianColvilleComancheCosta RicanCreeCreekCroatianCrowCubanCypriotCzechCzechoslovakianDanishDelawareDominicanDutchDutch West IndianEastern EuropeanEcuadorianEgyptianEnglishEstonianEthiopianEuropeanFijianFilipinoFinnishFrenchFrench American IndianFrench CanadianGermanGerman RussianGhanaianGreekGuamanian/ChamorroGuatemalanGuyaneseHaitianHmongHonduranHopiHoumaHungarianIcelanderIndian (Asian)IndonesianInupiatIranianIraqiIrishIroquoisIsraeliItalianJamaicanJapaneseJordanianKenyanKiowaKoreanLaotianLatvianLebaneseLiberianLithuanianLumbeeLuxembourgerMacedonianMalaysianMalteseMarshalleseMenomineeMexicanMexican American IndianMongolianMoroccanNative HawaiianNavajoNepaleseNew ZealanderNicaraguanNigerianNorthern EuropeanNorwegianOkinawanOsageOttawaPaiutePakistaniPalestinianPanamanianParaguayanPennsylvania GermanPeruvianPimaPolishPortuguesePotawatomiPuebloPuerto RicanPuget Sound SalishRomanianRussianSalvadoranSamoanScandinavianScotch-IrishScottishSeminoleSenegaleseSerbianShoshoneSierra LeoneanSiouxSlavicSlovakSloveneSomaliSouth AfricanSouth AmericanSouth American IndianSoviet UnionSpaniardSpanishSpanish AmericanSpanish American IndianSri LankanSubsaharan AfricanSudaneseSwedishSwissSyrianTaiwaneseThaiTlingit-HaidaTohono O'OdhamTonganTrinidadian and TobagonianTsimshianTurkishU.S. Virgin IslanderUgandanUkrainianUruguayanUteVenezuelanVietnameseWelshWest IndianYakamaYaquiYugoslavianYumanYup'ikZimbabwean
Immigration
NonimmigrantsImmigrantsAfghanistanAfricaAlbaniaArgentinaArmeniaAsiaAustraliaAustriaBahamasBangladeshBarbadosBelarusBelgiumBelizeBoliviaBosnia and HerzegovinaBrazilBulgariaBurma/MyanmarCabo VerdeCambodiaCameroonCanadaCaribbeanCentral AmericaChileChinaColombiaCongoCosta RicaCroatiaCubaCzechoslovakiaDenmarkDominicaDominican RepublicEastern AfricaEastern AsiaEastern EuropeEcuadorEgyptEl SalvadorEnglandEritreaEthiopiaEuropeFijiFranceGermanyGhanaGreeceGrenadaGuatemalaGuyanaHaitiHondurasHong KongHungaryIndiaIndonesiaIranIraqIrelandIsraelItalyJamaicaJapanJordanKazakhstanKenyaKoreaKuwaitLaosLatin AmericaLatviaLebanonLiberiaLithuaniaMalaysiaMexicoMicronesiaMiddle AfricaMoldovaNepalNetherlandsNicaraguaNigeriaNorth AmericaNorth MacedoniaNorthern AfricaNorthern EuropeNorwayOceaniaPakistanPanamaPeruPhilippinesPolandPortugalRomaniaRussiaSaudi ArabiaScotlandSenegalSerbiaSierra LeoneSingaporeSomaliaSouth AfricaSouth AmericaSouth Central AsiaSouth Eastern AsiaSouthern EuropeSpainSri LankaSt. Vincent and the GrenadinesSudanSwedenSwitzerlandSyriaTaiwanThailandTrinidad and TobagoTurkeyUgandaUkraineUruguayUzbekistanVenezuelaVietnamWest IndiesWestern AfricaWestern AsiaWestern EuropeYemenZaireZimbabweAzores
Immigrants from Morocco
Race
Ancestry
AfghanAfricanAlaska NativeAlaskan AthabascanAlbanianAleutAlsatianAmericanApacheArabArapahoArgentineanArmenianAssyrian/Chaldean/SyriacAustralianAustrianBahamianBangladeshiBarbadianBasqueBelgianBelizeanBermudanBhutaneseBlackfeetBolivianBrazilianBritishBritish West IndianBulgarianBurmeseCajunCambodianCanadianCape VerdeanCarpatho RusynCelticCentral AmericanCentral American IndianCherokeeCheyenneChickasawChileanChineseChoctawColombianColvilleComancheCosta RicanCreeCreekCroatianCrowCubanCypriotCzechCzechoslovakianDanishDelawareDominicanDutchDutch West IndianEastern EuropeanEcuadorianEgyptianEnglishEstonianEthiopianEuropeanFijianFilipinoFinnishFrenchFrench American IndianFrench CanadianGermanGerman RussianGhanaianGreekGuamanian/ChamorroGuatemalanGuyaneseHaitianHmongHonduranHopiHoumaHungarianIcelanderIndian (Asian)IndonesianInupiatIranianIraqiIrishIroquoisIsraeliItalianJamaicanJapaneseJordanianKenyanKiowaKoreanLaotianLatvianLebaneseLiberianLithuanianLumbeeLuxembourgerMacedonianMalaysianMalteseMarshalleseMenomineeMexicanMexican American IndianMongolianMoroccanNative HawaiianNavajoNepaleseNew ZealanderNicaraguanNigerianNorthern EuropeanNorwegianOkinawanOsageOttawaPaiutePakistaniPalestinianPanamanianParaguayanPennsylvania GermanPeruvianPimaPolishPortuguesePotawatomiPuebloPuerto RicanPuget Sound SalishRomanianRussianSalvadoranSamoanScandinavianScotch-IrishScottishSeminoleSenegaleseSerbianShoshoneSierra LeoneanSiouxSlavicSlovakSloveneSomaliSouth AfricanSouth AmericanSouth American IndianSoviet UnionSpaniardSpanishSpanish AmericanSpanish American IndianSri LankanSubsaharan AfricanSudaneseSwedishSwissSyrianTaiwaneseThaiTlingit-HaidaTohono O'OdhamTonganTrinidadian and TobagonianTsimshianTurkishU.S. Virgin IslanderUgandanUkrainianUruguayanUteVenezuelanVietnameseWelshWest IndianYakamaYaquiYugoslavianYumanYup'ikZimbabwean
Immigration
NonimmigrantsImmigrantsAfghanistanAfricaAlbaniaArgentinaArmeniaAsiaAustraliaAustriaBahamasBangladeshBarbadosBelarusBelgiumBelizeBoliviaBosnia and HerzegovinaBrazilBulgariaBurma/MyanmarCabo VerdeCambodiaCameroonCanadaCaribbeanCentral AmericaChileChinaColombiaCongoCosta RicaCroatiaCubaCzechoslovakiaDenmarkDominicaDominican RepublicEastern AfricaEastern AsiaEastern EuropeEcuadorEgyptEl SalvadorEnglandEritreaEthiopiaEuropeFijiFranceGermanyGhanaGreeceGrenadaGuatemalaGuyanaHaitiHondurasHong KongHungaryIndiaIndonesiaIranIraqIrelandIsraelItalyJamaicaJapanJordanKazakhstanKenyaKoreaKuwaitLaosLatin AmericaLatviaLebanonLiberiaLithuaniaMalaysiaMexicoMicronesiaMiddle AfricaMoldovaMoroccoNepalNetherlandsNicaraguaNigeriaNorth AmericaNorth MacedoniaNorthern AfricaNorthern EuropeNorwayOceaniaPakistanPanamaPeruPhilippinesPolandPortugalRomaniaRussiaSaudi ArabiaScotlandSenegalSerbiaSierra LeoneSingaporeSomaliaSouth AfricaSouth AmericaSouth Central AsiaSouth Eastern AsiaSouthern EuropeSpainSri LankaSt. Vincent and the GrenadinesSudanSwedenSwitzerlandSyriaTaiwanThailandTrinidad and TobagoTurkeyUgandaUkraineUruguayUzbekistanVenezuelaVietnamWest IndiesWestern AfricaWestern AsiaWestern EuropeYemenZaireZimbabweAzores
Disability Age 35 to 64
Income
Poverty
Unemployment
Labor Participation
Family Structure
Vehicle Availability
Education Level
Disability

Disability Age 35 to 64 Comparison

Chippewa

Immigrants from Morocco

Tragic
Exceptional
15.0%
DISABILITY AGE 35 TO 64
0.0/ 100
METRIC RATING
324th/ 347
METRIC RANK
10.5%
DISABILITY AGE 35 TO 64
96.6/ 100
METRIC RATING
114th/ 347
METRIC RANK

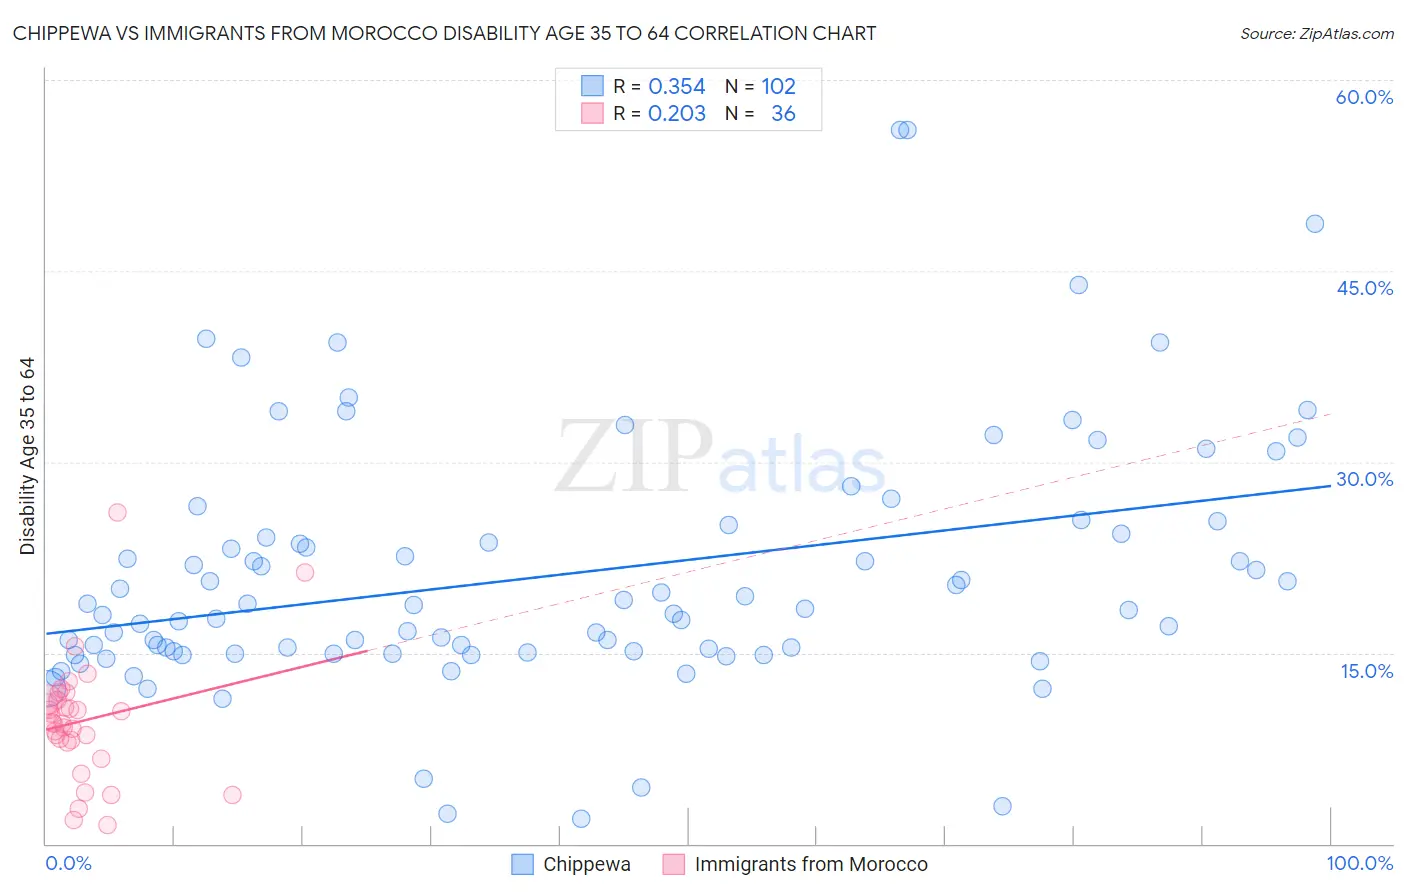
Chippewa vs Immigrants from Morocco Disability Age 35 to 64 Correlation Chart

The statistical analysis conducted on geographies consisting of 214,987,125 people shows a mild positive correlation between the proportion of Chippewa and percentage of population with a disability between the ages 34 and 64 in the United States with a correlation coefficient (R) of 0.354 and weighted average of 15.0%. Similarly, the statistical analysis conducted on geographies consisting of 178,904,714 people shows a weak positive correlation between the proportion of Immigrants from Morocco and percentage of population with a disability between the ages 34 and 64 in the United States with a correlation coefficient (R) of 0.203 and weighted average of 10.5%, a difference of 42.3%.
Chippewa vs Immigrants from Morocco Disability Age 35 to 64

Disability Age 35 to 64 Correlation Summary

MeasurementChippewaImmigrants from Morocco
Minimum2.0%1.5%
Maximum56.1%26.0%
Range54.1%24.5%
Mean21.1%9.7%
Median18.4%9.5%
Interquartile 25% (IQ1)15.0%8.0%
Interquartile 75% (IQ3)24.3%11.3%
Interquartile Range (IQR)9.3%3.3%
Standard Deviation (Sample)10.0%4.8%
Standard Deviation (Population)9.9%4.7%

Similar Demographics by Disability Age 35 to 64

Demographics Similar to Chippewa by Disability Age 35 to 64

In terms of disability age 35 to 64, the demographic groups most similar to Chippewa are Apache (14.9%, a difference of 0.20%), Arapaho (15.1%, a difference of 0.66%), Potawatomi (14.8%, a difference of 1.4%), Comanche (14.7%, a difference of 1.5%), and Black/African American (14.7%, a difference of 1.7%).
DemographicsRating | RankDisability Age 35 to 64
Crow
0.0
/100
|
#317
Tragic
14.6%
Ottawa
0.0
/100
|
#318
Tragic
14.6%
Immigrants | Cabo Verde
0.0
/100
|
#319
Tragic
14.7%
Blacks/African Americans
0.0
/100
|
#320
Tragic
14.7%
Comanche
0.0
/100
|
#321
Tragic
14.7%
Potawatomi
0.0
/100
|
#322
Tragic
14.8%
Apache
0.0
/100
|
#323
Tragic
14.9%
Chippewa
0.0
/100
|
#324
Tragic
15.0%
Arapaho
0.0
/100
|
#325
Tragic
15.1%
Natives/Alaskans
0.0
/100
|
#326
Tragic
15.3%
Pueblo
0.0
/100
|
#327
Tragic
15.3%
Cajuns
0.0
/100
|
#328
Tragic
15.3%
Cherokee
0.0
/100
|
#329
Tragic
15.5%
Navajo
0.0
/100
|
#330
Tragic
15.5%
Dutch West Indians
0.0
/100
|
#331
Tragic
15.6%

Demographics Similar to Immigrants from Morocco by Disability Age 35 to 64

In terms of disability age 35 to 64, the demographic groups most similar to Immigrants from Morocco are Tongan (10.5%, a difference of 0.050%), Assyrian/Chaldean/Syriac (10.5%, a difference of 0.17%), Immigrants from Netherlands (10.5%, a difference of 0.17%), Brazilian (10.5%, a difference of 0.20%), and Korean (10.5%, a difference of 0.40%).
DemographicsRating | RankDisability Age 35 to 64
Zimbabweans
97.4
/100
|
#107
Exceptional
10.4%
Ethiopians
97.4
/100
|
#108
Exceptional
10.5%
Immigrants | Ethiopia
97.2
/100
|
#109
Exceptional
10.5%
Koreans
97.1
/100
|
#110
Exceptional
10.5%
Brazilians
96.9
/100
|
#111
Exceptional
10.5%
Assyrians/Chaldeans/Syriacs
96.8
/100
|
#112
Exceptional
10.5%
Tongans
96.6
/100
|
#113
Exceptional
10.5%
Immigrants | Morocco
96.6
/100
|
#114
Exceptional
10.5%
Immigrants | Netherlands
96.3
/100
|
#115
Exceptional
10.5%
Immigrants | Nepal
95.9
/100
|
#116
Exceptional
10.6%
Immigrants | South Eastern Asia
95.7
/100
|
#117
Exceptional
10.6%
Immigrants | Moldova
95.5
/100
|
#118
Exceptional
10.6%
Luxembourgers
95.5
/100
|
#119
Exceptional
10.6%
Vietnamese
95.4
/100
|
#120
Exceptional
10.6%
Romanians
95.0
/100
|
#121
Exceptional
10.6%