Chilean vs Osage Hearing Disability
COMPARE
Chilean
Osage
Hearing Disability
Hearing Disability Comparison
Chileans
Osage
2.9%
HEARING DISABILITY
85.8/ 100
METRIC RATING
132nd/ 347
METRIC RANK
4.1%
HEARING DISABILITY
0.0/ 100
METRIC RATING
324th/ 347
METRIC RANK
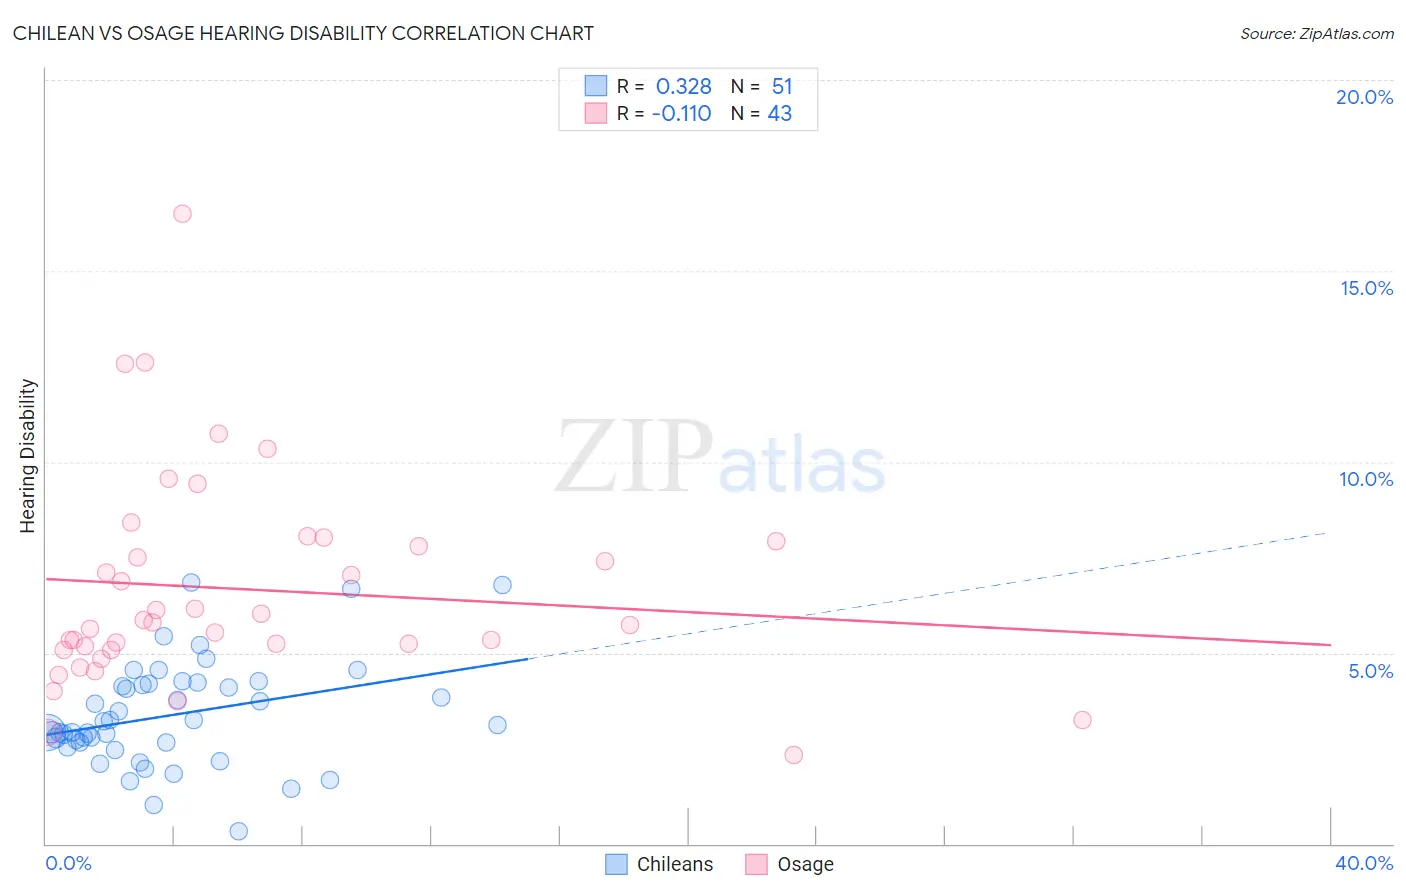
Chilean vs Osage Hearing Disability Correlation Chart
The statistical analysis conducted on geographies consisting of 256,625,228 people shows a mild positive correlation between the proportion of Chileans and percentage of population with hearing disability in the United States with a correlation coefficient (R) of 0.328 and weighted average of 2.9%. Similarly, the statistical analysis conducted on geographies consisting of 91,798,863 people shows a poor negative correlation between the proportion of Osage and percentage of population with hearing disability in the United States with a correlation coefficient (R) of -0.110 and weighted average of 4.1%, a difference of 42.7%.
Hearing Disability Correlation Summary
| Measurement | Chilean | Osage |
| Minimum | 0.32% | 2.3% |
| Maximum | 6.9% | 16.5% |
| Range | 6.5% | 14.2% |
| Mean | 3.4% | 6.7% |
| Median | 3.1% | 5.8% |
| Interquartile 25% (IQ1) | 2.6% | 5.1% |
| Interquartile 75% (IQ3) | 4.2% | 7.9% |
| Interquartile Range (IQR) | 1.6% | 2.8% |
| Standard Deviation (Sample) | 1.4% | 2.8% |
| Standard Deviation (Population) | 1.4% | 2.8% |
Similar Demographics by Hearing Disability
Demographics Similar to Chileans by Hearing Disability
In terms of hearing disability, the demographic groups most similar to Chileans are Immigrants from Syria (2.9%, a difference of 0.0%), Immigrants from Kenya (2.9%, a difference of 0.050%), Ugandan (2.9%, a difference of 0.070%), Immigrants from Vietnam (2.9%, a difference of 0.14%), and Immigrants from Uganda (2.9%, a difference of 0.16%).
| Demographics | Rating | Rank | Hearing Disability |
| Immigrants | Albania | 88.5 /100 | #125 | Excellent 2.9% |
| Immigrants | Sudan | 87.8 /100 | #126 | Excellent 2.9% |
| South American Indians | 86.9 /100 | #127 | Excellent 2.9% |
| Immigrants | Western Asia | 86.9 /100 | #128 | Excellent 2.9% |
| Immigrants | Uganda | 86.6 /100 | #129 | Excellent 2.9% |
| Immigrants | Vietnam | 86.5 /100 | #130 | Excellent 2.9% |
| Immigrants | Kenya | 86.1 /100 | #131 | Excellent 2.9% |
| Chileans | 85.8 /100 | #132 | Excellent 2.9% |
| Immigrants | Syria | 85.8 /100 | #133 | Excellent 2.9% |
| Ugandans | 85.5 /100 | #134 | Excellent 2.9% |
| Soviet Union | 84.8 /100 | #135 | Excellent 2.9% |
| Immigrants | Brazil | 84.6 /100 | #136 | Excellent 2.9% |
| Sri Lankans | 84.1 /100 | #137 | Excellent 2.9% |
| Immigrants | Costa Rica | 84.0 /100 | #138 | Excellent 2.9% |
| Bermudans | 83.8 /100 | #139 | Excellent 2.9% |
Demographics Similar to Osage by Hearing Disability
In terms of hearing disability, the demographic groups most similar to Osage are Apache (4.1%, a difference of 0.070%), Seminole (4.1%, a difference of 0.19%), Lumbee (4.1%, a difference of 0.32%), Paiute (4.1%, a difference of 0.45%), and Potawatomi (4.1%, a difference of 0.61%).
| Demographics | Rating | Rank | Hearing Disability |
| Comanche | 0.0 /100 | #317 | Tragic 4.0% |
| Cheyenne | 0.0 /100 | #318 | Tragic 4.0% |
| Chippewa | 0.0 /100 | #319 | Tragic 4.0% |
| Shoshone | 0.0 /100 | #320 | Tragic 4.0% |
| Paiute | 0.0 /100 | #321 | Tragic 4.1% |
| Seminole | 0.0 /100 | #322 | Tragic 4.1% |
| Apache | 0.0 /100 | #323 | Tragic 4.1% |
| Osage | 0.0 /100 | #324 | Tragic 4.1% |
| Lumbee | 0.0 /100 | #325 | Tragic 4.1% |
| Potawatomi | 0.0 /100 | #326 | Tragic 4.1% |
| Arapaho | 0.0 /100 | #327 | Tragic 4.1% |
| Tohono O'odham | 0.0 /100 | #328 | Tragic 4.2% |
| Crow | 0.0 /100 | #329 | Tragic 4.2% |
| Natives/Alaskans | 0.0 /100 | #330 | Tragic 4.2% |
| Cherokee | 0.0 /100 | #331 | Tragic 4.2% |