Chilean vs Latvian Disability Age 35 to 64
COMPARE
Chilean
Latvian
Disability Age 35 to 64
Disability Age 35 to 64 Comparison
Chileans
Latvians
10.2%
DISABILITY AGE 35 TO 64
99.0/ 100
METRIC RATING
88th/ 347
METRIC RANK
10.2%
DISABILITY AGE 35 TO 64
99.2/ 100
METRIC RATING
81st/ 347
METRIC RANK
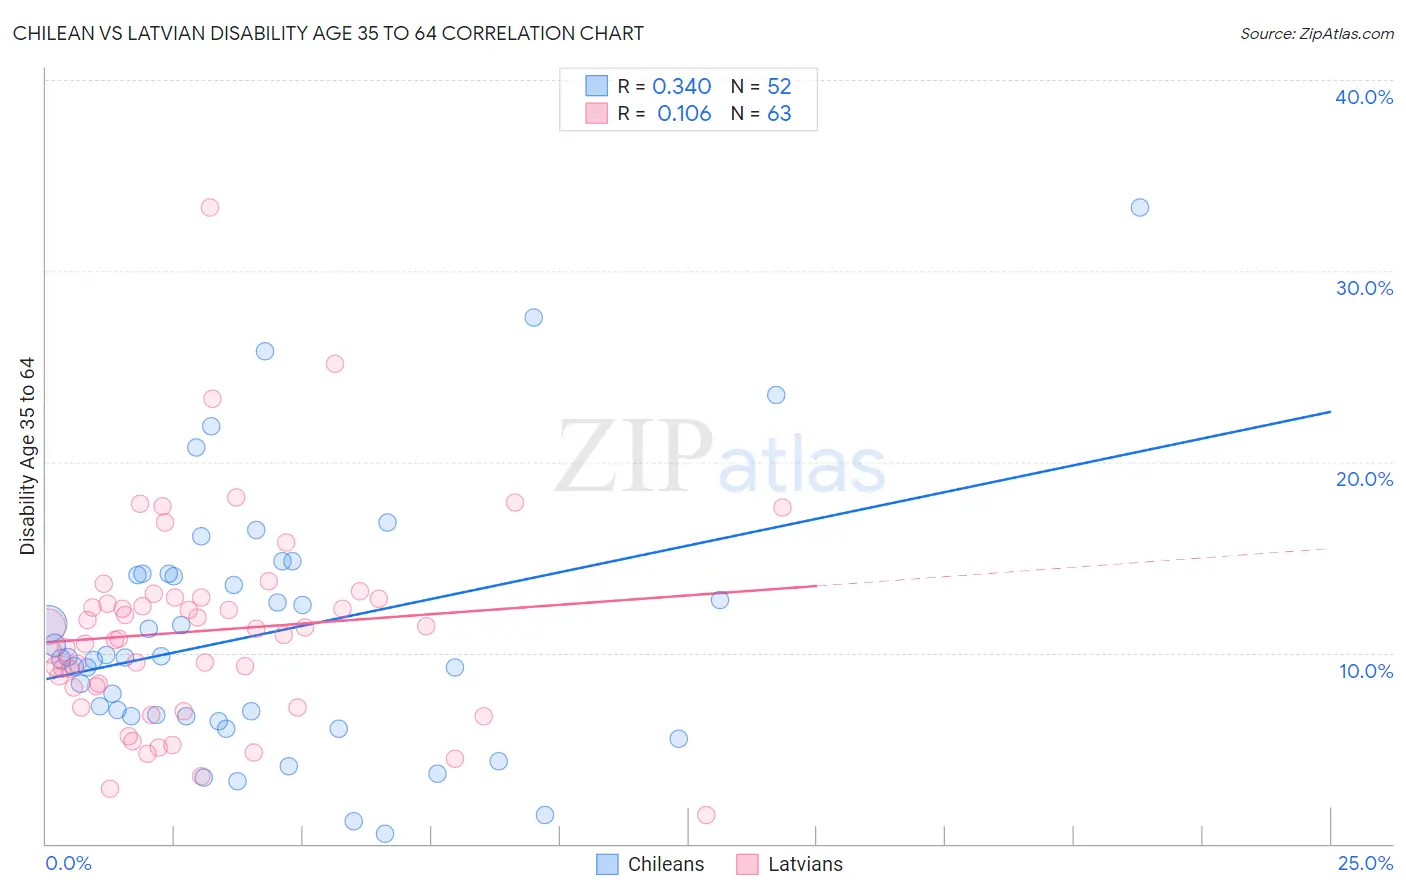
Chilean vs Latvian Disability Age 35 to 64 Correlation Chart
The statistical analysis conducted on geographies consisting of 256,534,411 people shows a mild positive correlation between the proportion of Chileans and percentage of population with a disability between the ages 34 and 64 in the United States with a correlation coefficient (R) of 0.340 and weighted average of 10.2%. Similarly, the statistical analysis conducted on geographies consisting of 220,634,735 people shows a poor positive correlation between the proportion of Latvians and percentage of population with a disability between the ages 34 and 64 in the United States with a correlation coefficient (R) of 0.106 and weighted average of 10.2%, a difference of 0.66%.
Disability Age 35 to 64 Correlation Summary
| Measurement | Chilean | Latvian |
| Minimum | 0.50% | 1.5% |
| Maximum | 33.3% | 33.4% |
| Range | 32.8% | 31.8% |
| Mean | 11.0% | 11.2% |
| Median | 9.8% | 10.9% |
| Interquartile 25% (IQ1) | 6.7% | 8.2% |
| Interquartile 75% (IQ3) | 14.1% | 12.9% |
| Interquartile Range (IQR) | 7.4% | 4.7% |
| Standard Deviation (Sample) | 6.8% | 5.4% |
| Standard Deviation (Population) | 6.7% | 5.3% |
Demographics Similar to Chileans and Latvians by Disability Age 35 to 64
In terms of disability age 35 to 64, the demographic groups most similar to Chileans are Uruguayan (10.2%, a difference of 0.010%), Afghan (10.3%, a difference of 0.12%), Immigrants from Lebanon (10.3%, a difference of 0.14%), Nicaraguan (10.2%, a difference of 0.23%), and Immigrants from Europe (10.2%, a difference of 0.24%). Similarly, the demographic groups most similar to Latvians are Russian (10.2%, a difference of 0.060%), Immigrants from Brazil (10.2%, a difference of 0.070%), Immigrants from Croatia (10.2%, a difference of 0.10%), Sri Lankan (10.2%, a difference of 0.13%), and Immigrants from Vietnam (10.1%, a difference of 0.23%).
| Demographics | Rating | Rank | Disability Age 35 to 64 |
| Laotians | 99.4 /100 | #74 | Exceptional 10.1% |
| Immigrants | Latvia | 99.4 /100 | #75 | Exceptional 10.1% |
| Immigrants | Chile | 99.4 /100 | #76 | Exceptional 10.1% |
| Mongolians | 99.4 /100 | #77 | Exceptional 10.1% |
| Jordanians | 99.3 /100 | #78 | Exceptional 10.1% |
| Immigrants | Vietnam | 99.3 /100 | #79 | Exceptional 10.1% |
| Immigrants | Croatia | 99.3 /100 | #80 | Exceptional 10.2% |
| Latvians | 99.2 /100 | #81 | Exceptional 10.2% |
| Russians | 99.2 /100 | #82 | Exceptional 10.2% |
| Immigrants | Brazil | 99.2 /100 | #83 | Exceptional 10.2% |
| Sri Lankans | 99.2 /100 | #84 | Exceptional 10.2% |
| Immigrants | Kuwait | 99.1 /100 | #85 | Exceptional 10.2% |
| Immigrants | Europe | 99.1 /100 | #86 | Exceptional 10.2% |
| Nicaraguans | 99.1 /100 | #87 | Exceptional 10.2% |
| Chileans | 99.0 /100 | #88 | Exceptional 10.2% |
| Uruguayans | 99.0 /100 | #89 | Exceptional 10.2% |
| Afghans | 98.9 /100 | #90 | Exceptional 10.3% |
| Immigrants | Lebanon | 98.9 /100 | #91 | Exceptional 10.3% |
| Immigrants | Northern Africa | 98.7 /100 | #92 | Exceptional 10.3% |
| Immigrants | North Macedonia | 98.7 /100 | #93 | Exceptional 10.3% |
| Immigrants | Italy | 98.7 /100 | #94 | Exceptional 10.3% |