Samoan vs Immigrants from Caribbean Disability Age Under 5
COMPARE
Samoan
Immigrants from Caribbean
Disability Age Under 5
Disability Age Under 5 Comparison
Samoans
Immigrants from Caribbean
1.2%
DISABILITY AGE UNDER 5
77.7/ 100
METRIC RATING
146th/ 347
METRIC RANK
1.2%
DISABILITY AGE UNDER 5
93.8/ 100
METRIC RATING
115th/ 347
METRIC RANK
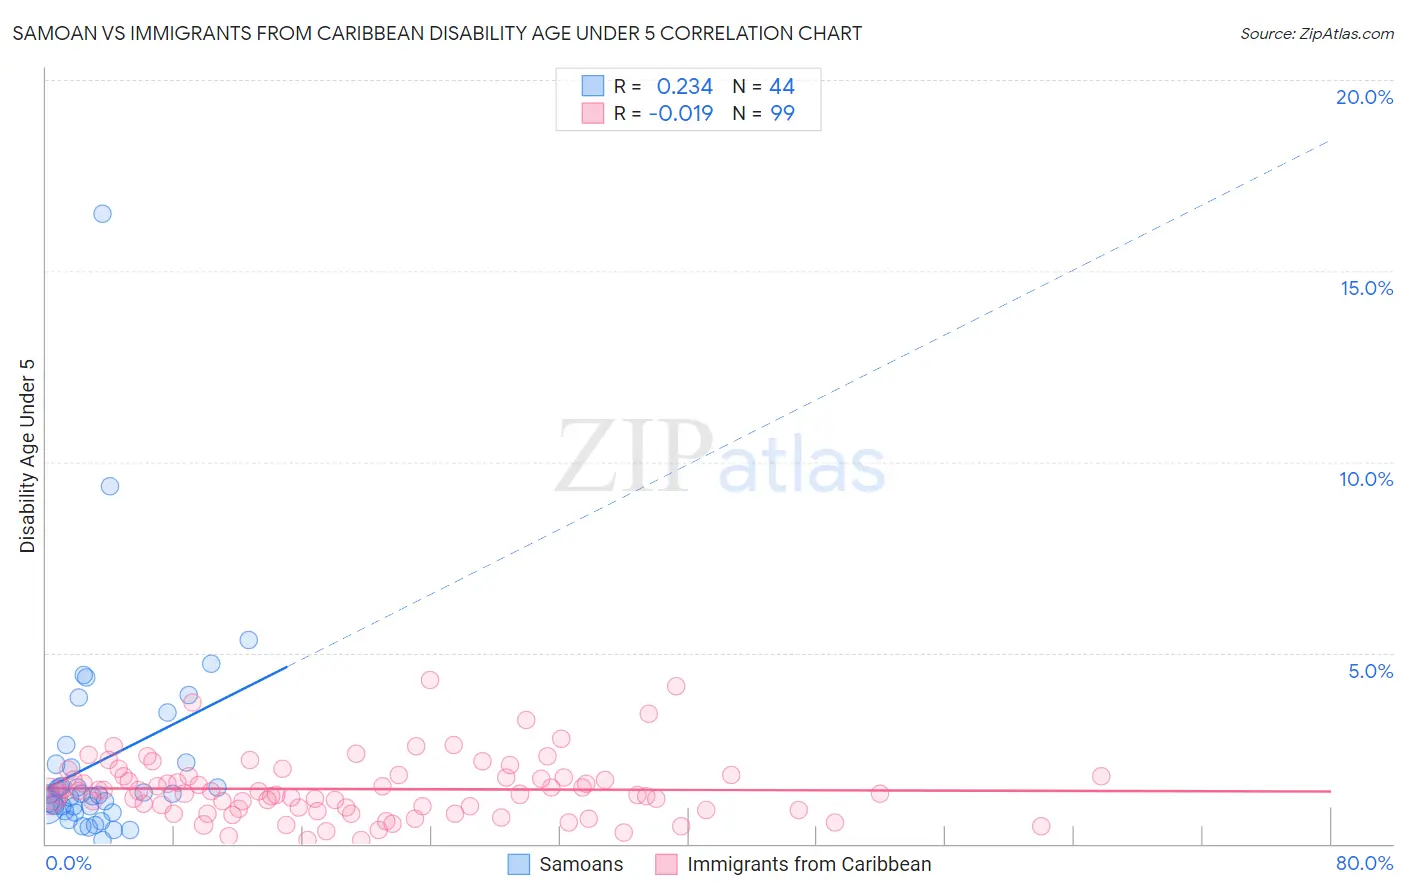
Samoan vs Immigrants from Caribbean Disability Age Under 5 Correlation Chart
The statistical analysis conducted on geographies consisting of 152,568,773 people shows a weak positive correlation between the proportion of Samoans and percentage of population with a disability under the age of 5 in the United States with a correlation coefficient (R) of 0.234 and weighted average of 1.2%. Similarly, the statistical analysis conducted on geographies consisting of 233,002,612 people shows no correlation between the proportion of Immigrants from Caribbean and percentage of population with a disability under the age of 5 in the United States with a correlation coefficient (R) of -0.019 and weighted average of 1.2%, a difference of 3.6%.
Disability Age Under 5 Correlation Summary
| Measurement | Samoan | Immigrants from Caribbean |
| Minimum | 0.11% | 0.090% |
| Maximum | 16.5% | 4.3% |
| Range | 16.4% | 4.2% |
| Mean | 2.2% | 1.4% |
| Median | 1.3% | 1.3% |
| Interquartile 25% (IQ1) | 0.91% | 0.88% |
| Interquartile 75% (IQ3) | 2.1% | 1.8% |
| Interquartile Range (IQR) | 1.2% | 0.88% |
| Standard Deviation (Sample) | 2.8% | 0.81% |
| Standard Deviation (Population) | 2.8% | 0.80% |
Similar Demographics by Disability Age Under 5
Demographics Similar to Samoans by Disability Age Under 5
In terms of disability age under 5, the demographic groups most similar to Samoans are Immigrants from Zimbabwe (1.2%, a difference of 0.040%), Icelander (1.2%, a difference of 0.18%), Ghanaian (1.2%, a difference of 0.19%), Alsatian (1.2%, a difference of 0.22%), and Immigrants from Middle Africa (1.2%, a difference of 0.22%).
| Demographics | Rating | Rank | Disability Age Under 5 |
| New Zealanders | 81.4 /100 | #139 | Excellent 1.2% |
| Somalis | 80.8 /100 | #140 | Excellent 1.2% |
| Immigrants | Honduras | 80.4 /100 | #141 | Excellent 1.2% |
| Immigrants | Colombia | 79.3 /100 | #142 | Good 1.2% |
| Alsatians | 79.3 /100 | #143 | Good 1.2% |
| Immigrants | Middle Africa | 79.3 /100 | #144 | Good 1.2% |
| Immigrants | Zimbabwe | 77.9 /100 | #145 | Good 1.2% |
| Samoans | 77.7 /100 | #146 | Good 1.2% |
| Icelanders | 76.3 /100 | #147 | Good 1.2% |
| Ghanaians | 76.3 /100 | #148 | Good 1.2% |
| Kenyans | 75.9 /100 | #149 | Good 1.2% |
| South Americans | 75.6 /100 | #150 | Good 1.2% |
| Yaqui | 74.8 /100 | #151 | Good 1.2% |
| Hondurans | 72.5 /100 | #152 | Good 1.2% |
| Immigrants | Thailand | 69.4 /100 | #153 | Good 1.2% |
Demographics Similar to Immigrants from Caribbean by Disability Age Under 5
In terms of disability age under 5, the demographic groups most similar to Immigrants from Caribbean are Belizean (1.2%, a difference of 0.010%), Immigrants from Northern Africa (1.2%, a difference of 0.020%), Immigrants from Philippines (1.2%, a difference of 0.15%), Immigrants from Oceania (1.2%, a difference of 0.16%), and Immigrants from Venezuela (1.2%, a difference of 0.19%).
| Demographics | Rating | Rank | Disability Age Under 5 |
| Iraqis | 95.1 /100 | #108 | Exceptional 1.2% |
| Immigrants | Panama | 95.0 /100 | #109 | Exceptional 1.2% |
| Immigrants | Lebanon | 95.0 /100 | #110 | Exceptional 1.2% |
| Senegalese | 94.6 /100 | #111 | Exceptional 1.2% |
| Immigrants | Australia | 94.4 /100 | #112 | Exceptional 1.2% |
| Immigrants | Oceania | 94.2 /100 | #113 | Exceptional 1.2% |
| Belizeans | 93.9 /100 | #114 | Exceptional 1.2% |
| Immigrants | Caribbean | 93.8 /100 | #115 | Exceptional 1.2% |
| Immigrants | Northern Africa | 93.8 /100 | #116 | Exceptional 1.2% |
| Immigrants | Philippines | 93.5 /100 | #117 | Exceptional 1.2% |
| Immigrants | Venezuela | 93.4 /100 | #118 | Exceptional 1.2% |
| Bhutanese | 92.5 /100 | #119 | Exceptional 1.2% |
| Immigrants | Eritrea | 92.3 /100 | #120 | Exceptional 1.2% |
| Immigrants | Senegal | 91.4 /100 | #121 | Exceptional 1.2% |
| Aleuts | 90.7 /100 | #122 | Exceptional 1.2% |