Cherokee vs Navajo Disability Age 35 to 64
COMPARE
Cherokee
Navajo
Disability Age 35 to 64
Disability Age 35 to 64 Comparison
Cherokee
Navajo
15.5%
DISABILITY AGE 35 TO 64
0.0/ 100
METRIC RATING
329th/ 347
METRIC RANK
15.5%
DISABILITY AGE 35 TO 64
0.0/ 100
METRIC RATING
330th/ 347
METRIC RANK
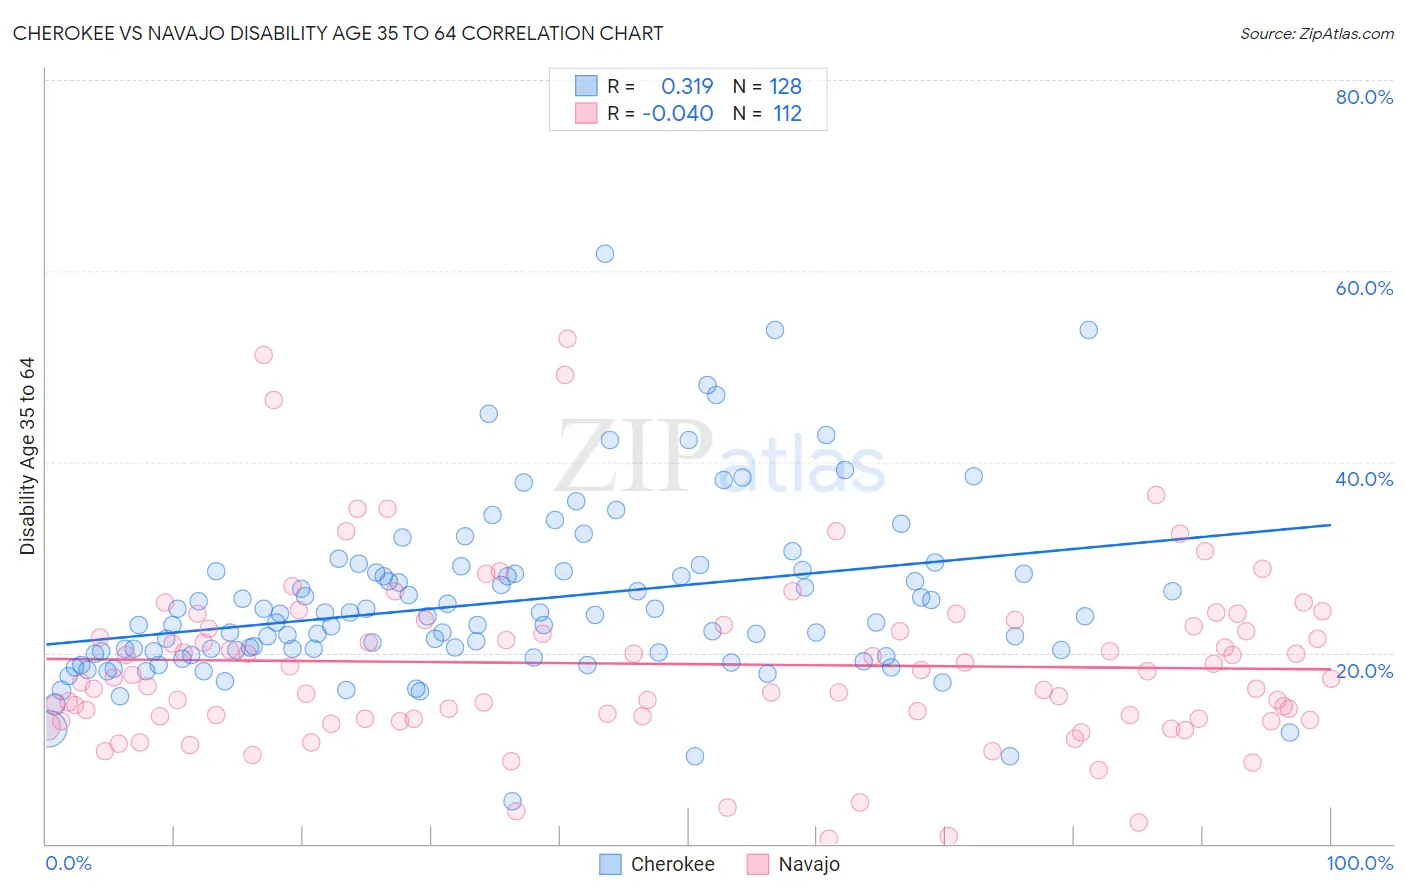
Cherokee vs Navajo Disability Age 35 to 64 Correlation Chart
The statistical analysis conducted on geographies consisting of 493,305,636 people shows a mild positive correlation between the proportion of Cherokee and percentage of population with a disability between the ages 34 and 64 in the United States with a correlation coefficient (R) of 0.319 and weighted average of 15.5%. Similarly, the statistical analysis conducted on geographies consisting of 224,738,454 people shows no correlation between the proportion of Navajo and percentage of population with a disability between the ages 34 and 64 in the United States with a correlation coefficient (R) of -0.040 and weighted average of 15.5%, a difference of 0.20%.
Disability Age 35 to 64 Correlation Summary
| Measurement | Cherokee | Navajo |
| Minimum | 4.4% | 0.53% |
| Maximum | 61.8% | 52.8% |
| Range | 57.4% | 52.3% |
| Mean | 25.2% | 18.8% |
| Median | 23.1% | 17.3% |
| Interquartile 25% (IQ1) | 19.9% | 13.1% |
| Interquartile 75% (IQ3) | 28.4% | 22.8% |
| Interquartile Range (IQR) | 8.4% | 9.7% |
| Standard Deviation (Sample) | 9.0% | 9.4% |
| Standard Deviation (Population) | 9.0% | 9.3% |
Demographics Similar to Cherokee and Navajo by Disability Age 35 to 64
In terms of disability age 35 to 64, the demographic groups most similar to Cherokee are Cajun (15.3%, a difference of 0.75%), Pueblo (15.3%, a difference of 0.93%), Native/Alaskan (15.3%, a difference of 0.95%), Dutch West Indian (15.6%, a difference of 1.1%), and Alaskan Athabascan (15.7%, a difference of 1.7%). Similarly, the demographic groups most similar to Navajo are Dutch West Indian (15.6%, a difference of 0.92%), Cajun (15.3%, a difference of 0.96%), Pueblo (15.3%, a difference of 1.1%), Native/Alaskan (15.3%, a difference of 1.2%), and Alaskan Athabascan (15.7%, a difference of 1.5%).
| Demographics | Rating | Rank | Disability Age 35 to 64 |
| Immigrants | Cabo Verde | 0.0 /100 | #319 | Tragic 14.7% |
| Blacks/African Americans | 0.0 /100 | #320 | Tragic 14.7% |
| Comanche | 0.0 /100 | #321 | Tragic 14.7% |
| Potawatomi | 0.0 /100 | #322 | Tragic 14.8% |
| Apache | 0.0 /100 | #323 | Tragic 14.9% |
| Chippewa | 0.0 /100 | #324 | Tragic 15.0% |
| Arapaho | 0.0 /100 | #325 | Tragic 15.1% |
| Natives/Alaskans | 0.0 /100 | #326 | Tragic 15.3% |
| Pueblo | 0.0 /100 | #327 | Tragic 15.3% |
| Cajuns | 0.0 /100 | #328 | Tragic 15.3% |
| Cherokee | 0.0 /100 | #329 | Tragic 15.5% |
| Navajo | 0.0 /100 | #330 | Tragic 15.5% |
| Dutch West Indians | 0.0 /100 | #331 | Tragic 15.6% |
| Alaskan Athabascans | 0.0 /100 | #332 | Tragic 15.7% |
| Yuman | 0.0 /100 | #333 | Tragic 15.8% |
| Colville | 0.0 /100 | #334 | Tragic 15.8% |
| Seminole | 0.0 /100 | #335 | Tragic 15.9% |
| Menominee | 0.0 /100 | #336 | Tragic 15.9% |
| Puerto Ricans | 0.0 /100 | #337 | Tragic 15.9% |
| Chickasaw | 0.0 /100 | #338 | Tragic 16.1% |
| Pima | 0.0 /100 | #339 | Tragic 16.1% |